- Home
- News
- Spotlight on Science
- Structure of a photocatalyst-w...
Structure of a photocatalyst-water interface
31-01-2017
Titanium dioxide was shown to be an active photocatalyst for water splitting more than forty years ago. Despite a truly enormous effort by the scientific community, the photocatalytic efficiency has remained stubbornly low. In part this is because of the huge challenge to obtain accurate data on the structure and dynamics associated with the photocatalytic process. Surface X-ray diffraction measurements have now revealed the structure of a model photocatalytic interface.
The interaction of water with TiO2 is crucial to many of its practical applications, including photocatalytic water splitting. Following the first demonstration of this phenomenon 40 years ago [1] there have been numerous studies of the rutile single crystal TiO2(110) interface with water [2]. This has provided an atomic level understanding of the water/TiO2 interaction. However, nearly all the previous studies of water/TiO2 interfaces involve water in the vapour phase.
In this work, we have explored the interfacial structure between liquid water and a rutile TiO2(110) surface pre-characterised at the atomic level. Scanning-tunnelling microscopy and surface X-ray diffraction were used to determine the structure, which is comprised of an ordered array of hydroxyl molecules with molecular water in the second layer. Static and dynamic density functional theory calculations suggest that a possible mechanism for formation of the hydroxyl overlayer involves the mixed adsorption of O2 and H2O on a partially defected surface. The quantitative structural properties derived here provide a basis with which to explore the atomistic properties and hence mechanisms involved in TiO2 photocatalysis.
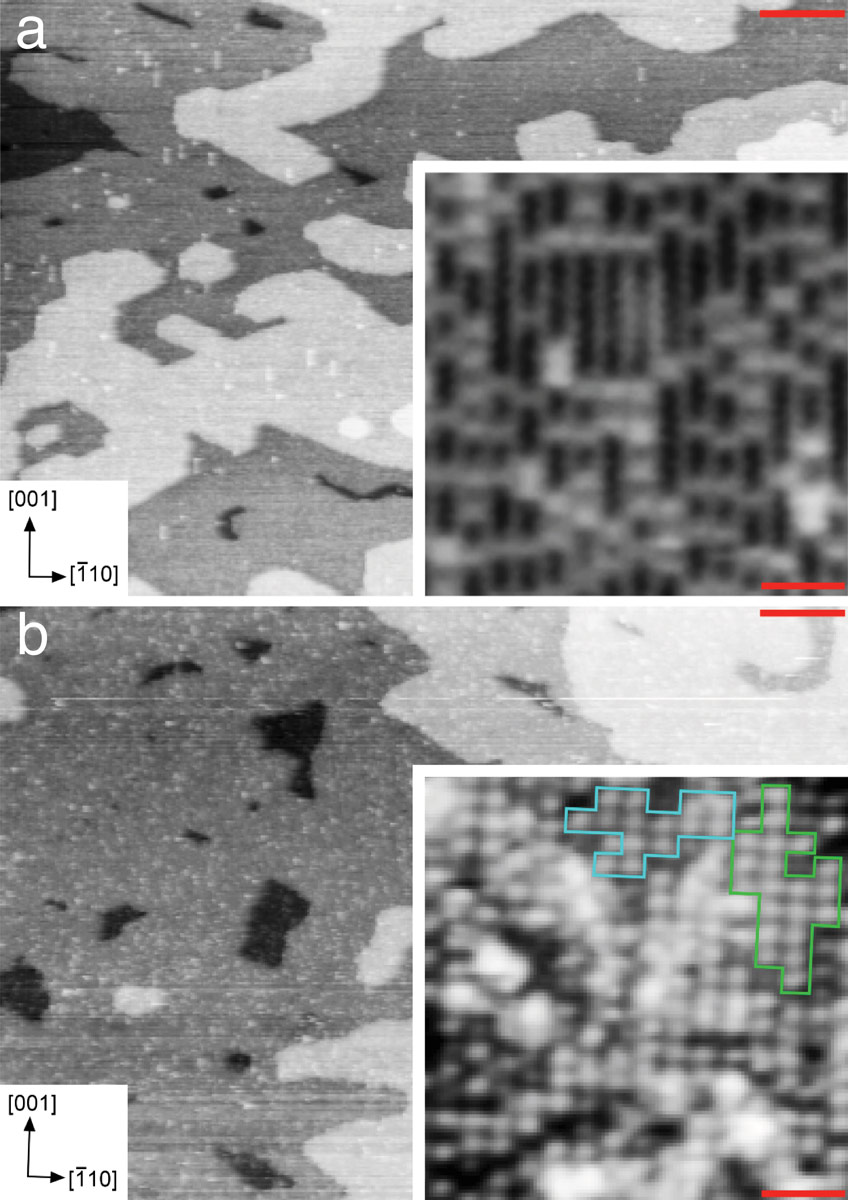
A novel approach was employed to provide the first quantitative structure of a well-defined metal oxide-water interface formed by either temporarily immersing (dipping) a rutile TiO2(110) surface into water or by depositing a water droplet on the surface, respectively. Both ex situ and in situ measurements of the liquid water-TiO2 interface were carried out in an aerobic environment using SXRD at beamline ID32 (a former XSW and surface diffraction beamline). Pre-characterisation at the atomic level carried out at both the UCL and the ESRF was essential to the success of the SXRD experiment. Figure 1a displays STM images of the as-prepared TiO2(110) surface. In the high-resolution image of the inset, bright (Ti) rows are seen that run in the [001] direction. Bright spots are also present and these are a mixture of bridging oxygen vacancies (Ob-vacs) and bridging hydroxyls (OHb), the latter being formed by water dissociation at defect sites. After venting to N2 and immersion in 10 ml water (18.2 MΩ.cm, total organic content < 2 ppm) for 5 mins, the sample (H2Odip sample) was reintroduced to UHV. STM images of the H2Odip sample are shown in Figure 1b. The high-resolution image shown in the inset evidences a (2×1) overlayer. Antiphase domains of this overlayer can form by an offset of one unit cell along the [001] direction.
 |
|
Figure 1. STM images (0.2 nA, Vs = 1.2 V) of the TiO2(110) surface before (a) and after immersion in liquid water (b). In the large-area images, the scale bars are 100 Å and in the insets 20 Å. Before immersion, the TiO2(110) surface is characterised by bright rows that arise from Ti5c atoms and bright spots that correspond to Ob-vac (0.11 ML) and OHb (0.10 L). After immersion in liquid water to form the H2Odip sample, the surface is characterised by bright spots arranged with a (2×1) periodicity. The blue and green shapes mark areas that are particularly well ordered. Note that these two areas are antiphase domains; the bright spots are offset by one TiO2 surface unit cell in the [001] direction. |
To probe the chemical nature of the (2×1) overlayer, we employed X-ray and UV photoelectron spectroscopy (XPS, UPS). XPS spectra taken before and after immersion of TiO2(110) in water display a peak at ~532 eV binding energy in the O 1s spectrum that originates from OH, which becomes more intense after immersion. Similarly, in UPS spectra taken after immersion in water, peaks appear at 8.0 and 10.2 eV below the Fermi level (EF) that are characteristic of chemisorbed OH. UPS also detects a band-gap state (BGS) associated with Ob-vac and OHb that lies ~0.8 eV below EF. This BGS is quenched after immersion in water, which can be explained by healing of the Ob-vacs/OHb by exposure to O2 during the N2 venting procedure.
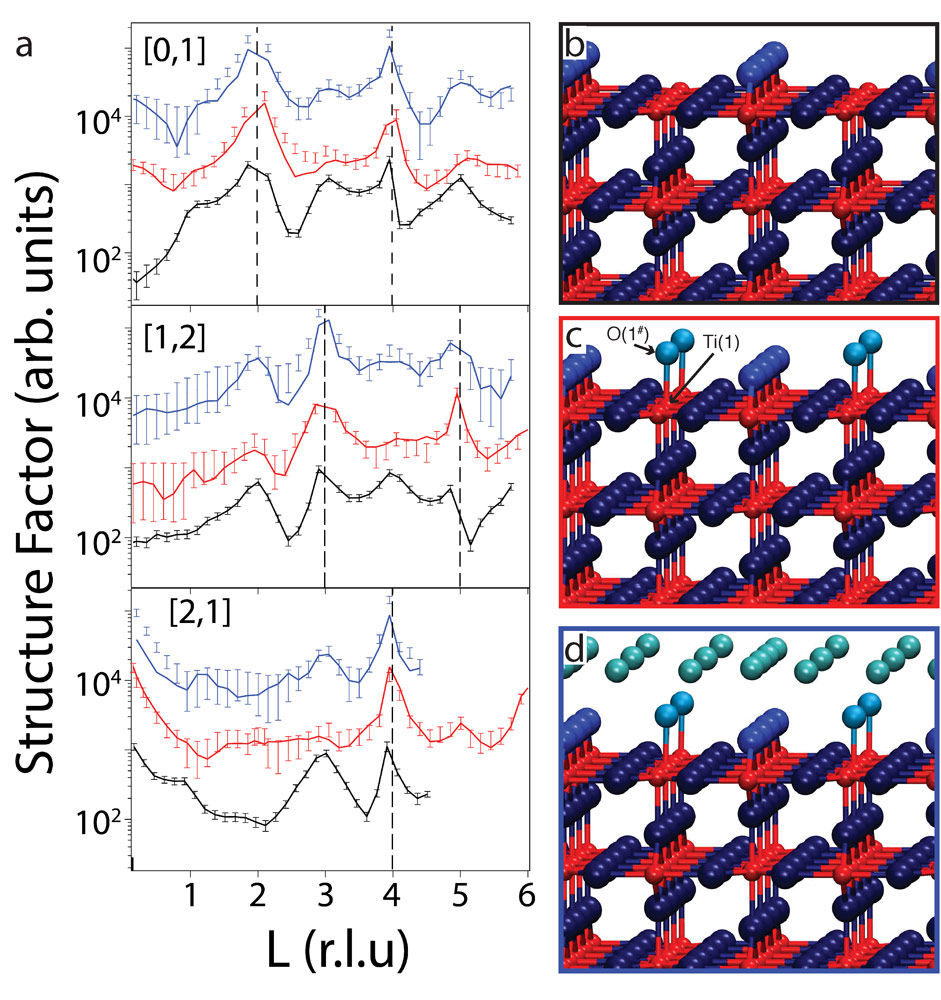
Figure 2a shows selected SXRD results in the form of crystal truncation rods (CTRs) recorded from the H2Odip and H2Odrop surfaces together with those from the as-prepared UHV surface. Best fits to the data are also shown in Figure 2a. A model for the clean surface is shown in Figure 2b and the best-fit model for the H2Odip and H2Odrop surfaces are shown in Figure 2, c and d, respectively. Due to its low X-ray scattering contribution, hydrogen is not included in the analysis and is not shown in the model. Instead, water molecules or hydroxyls are represented only by their oxygen atoms. The bond distance between O(1#) and Ti(2) (see Figure 2c) is 1.95 ± 0.03 Å, which is in good agreement with the literature value for the Ti–OHt (terminal OH) bond of 1.85 ± 0.08 Å. Hence, we assign O(1#) to OHt, which is also consistent with our photoelectron spectroscopy data. The OHt molecule has occupancy of 0.45±0.1, consistent with the STM results. For the H2Odrop surface, the best-fit model is essentially the same as that of the H2Odip model (Figure 2c), except for the presence of a hydration layer above the (2×1) OHt contact layer.
 |
|
Figure 2. Selected CTRs from the SXRD measurements alongside proposed models. (a) The structure factors of the different TiO2(110) surfaces are plotted for the (0,1,l), (1,2,l) and (2,1,l) CTRs. Black, red, and blue error bars represent the data from the as-prepared surface recorded before the H2Odrop experiment, H2Odip, and H2Odrop samples, respectively, with solid lines being the calculated data. Profiles are offset for clarity. Dashed vertical lines correspond to Bragg peaks. (b-d) Ball-stick models for clean, H2Odip, and H2Odrop samples, respectively. |
Principal publication and authors
Structure of a model TiO2 photocatalytic interface, H. Hussain (a,b), G. Tocci (a), T. Woolcot (a), X. Torrelles (c), C.L. Pang (a), D.S. Humphrey (a), C.M. Yim (a), D.C. Grinter (a), G. Cabailh (d,e), O. Bikondoa (f), R. Lindsay (g), J. Zegenhagen (b), A. Michaelides (a), G. Thornton (a), Nature Materials (2016); doi: 10.1038/nmat4793.
(a) London Centre for Nanotechnology and Department of Chemistry, University College London (UK)
(b) ESRF
(c) Institut de Ciència de Materials de Barcelona (CSIC), Bellaterra (Spain)
(d) Sorbonne Universités, Paris (France)
(e) CNRS, Institut des NanoSciences de Paris (France)
(f) Department of Physics, University of Warwick, Coventry (UK)
(g) Corrosion and Protection Centre, School of Materials, The University of Manchester (UK)
References
[1] A. Fujishima & K. Honda, Nature 238, 37 (1972).
[2] C.L. Pang et al., Chem. Rev. 113, 3887 (2013).
partners


European Synchrotron Radiation Facility - 71, avenue des Martyrs, CS 40220, 38043 Grenoble Cedex 9, France.