- Home
- Users & Science
- Scientific Documentation
- ESRF Highlights
- ESRF Highlights 2004
- X-ray Absorption and Magnetic Scattering
- Fermi Surface of the High-temperature Superconductor Nd1.85Ce0.15CuO4
Fermi Surface of the High-temperature Superconductor Nd1.85Ce0.15CuO4
One of the fundamental problems in contemporary physics is the understanding of high-temperature-superconductivity (HTS). Even though HTS was first discovered in 1986 and a large amount of experimental and theoretical work has been carried out since then, it is still unclear what the underlying mechanism is.
A fundamental characteristic of a material is its spectral function A(![]() ,k) or band structure which gives the electron momentum and corresponding energy of allowed electronic states in the material. Angle-resolved photoelectron spectroscopy (ARPES) is a direct experimental way of determining the band structure of solids and it has been extensively used in the study of high temperature superconductors during recent years. Many important results concerning the shape of the superconducting gap, phonon interactions etc. have been obtained. A crucial question in the use of ARPES is, however, the surface sensitivity of the technique. Most ARPES measurements are performed at 20-40 eV photon energy where the outermost surface layer gives the main contribution to the intensity. It has generally been believed that this was not an issue in the case of HTS compounds since these are layered materials with an electronic structure that is quasi-2-dimensional. In order to verify the validity of this assumption, we have performed bulk sensitive ARPES measurements in the soft X-ray range at beamline ID08.
,k) or band structure which gives the electron momentum and corresponding energy of allowed electronic states in the material. Angle-resolved photoelectron spectroscopy (ARPES) is a direct experimental way of determining the band structure of solids and it has been extensively used in the study of high temperature superconductors during recent years. Many important results concerning the shape of the superconducting gap, phonon interactions etc. have been obtained. A crucial question in the use of ARPES is, however, the surface sensitivity of the technique. Most ARPES measurements are performed at 20-40 eV photon energy where the outermost surface layer gives the main contribution to the intensity. It has generally been believed that this was not an issue in the case of HTS compounds since these are layered materials with an electronic structure that is quasi-2-dimensional. In order to verify the validity of this assumption, we have performed bulk sensitive ARPES measurements in the soft X-ray range at beamline ID08.
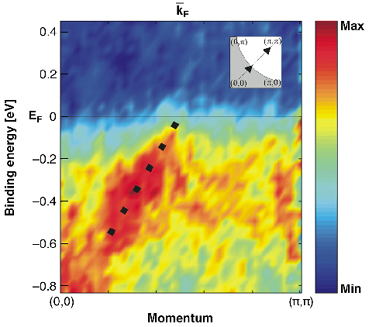 |
Fig. 126: Dispersion measured along a high symmetry line in Nd1.85Ce0.15CuO4. The dotted line is a guide to the eye. |
Using the latest advances in spectrometer and detector design it has been possible to measure the valence band dispersion in Nd1.85Ce0.15CuO4 (NCCO) with 400 eV photons. An example of the observed dispersion is given in Figure 126 where the dispersion is plotted as a colour intensity plot. The figure shows an electron state that moves towards the Fermi level as the momentum is changed from (0,0) to (![]() ,
,![]() ). Approximately halfway along the line, the state crosses the Fermi level and becomes unoccupied. This point in momentum space divides occupied states from unoccupied states and defines a point on the so called Fermi surface within which the electrons reside. The shape and volume of the Fermi surface gives information about properties such as the electron density, electron velocity and important scattering mechanisms in the material. By measuring a large number of spectra, such as those in Figure 126, one can thus determine the shape of the Fermi surface for a particular material. In the case of a simple three-dimensional metal, such as an alkali metal, the electrons are nearly free and the energy is proportional to the momentum amplitude squared (parabolic dispersion). The Fermi surface is therefore given by a sphere in momentum space. For anisotropic materials and materials where correlation effects are important, the Fermi surface will deviate strongly from a sphere and one can, roughly speaking, use the amount of deviation as a measure of correlation effects. In Figure 127, we show the Fermi surface of NCCO (or the Fermi line to be correct since NCCO is a two dimensional material). The Fermi surface was determined by accumulating a large number of spectra similar to the one in Figure 126. Looking at the shape of the intensity in Figure 127, one sees that it traces something that is closer to a square than a circle. Also shown is the Fermi surface as determined by earlier low energy measurements [1]. Comparing the two, one observes that the low energy measurement gives a Fermi surface that is closer to a circle. Following the general arguments given above, we conclude that the high energy data indicates the presence of stronger electron correlation in the bulk as compared to the surface. This result is surprising since any difference in the strength of electron correlations between bulk and surface is expected to be the opposite of what is observed here due to the reduced coordination at the surface. The reason for increased correlation in the bulk and the possible generalisation of the present result to other HTS compounds is still an open question.
). Approximately halfway along the line, the state crosses the Fermi level and becomes unoccupied. This point in momentum space divides occupied states from unoccupied states and defines a point on the so called Fermi surface within which the electrons reside. The shape and volume of the Fermi surface gives information about properties such as the electron density, electron velocity and important scattering mechanisms in the material. By measuring a large number of spectra, such as those in Figure 126, one can thus determine the shape of the Fermi surface for a particular material. In the case of a simple three-dimensional metal, such as an alkali metal, the electrons are nearly free and the energy is proportional to the momentum amplitude squared (parabolic dispersion). The Fermi surface is therefore given by a sphere in momentum space. For anisotropic materials and materials where correlation effects are important, the Fermi surface will deviate strongly from a sphere and one can, roughly speaking, use the amount of deviation as a measure of correlation effects. In Figure 127, we show the Fermi surface of NCCO (or the Fermi line to be correct since NCCO is a two dimensional material). The Fermi surface was determined by accumulating a large number of spectra similar to the one in Figure 126. Looking at the shape of the intensity in Figure 127, one sees that it traces something that is closer to a square than a circle. Also shown is the Fermi surface as determined by earlier low energy measurements [1]. Comparing the two, one observes that the low energy measurement gives a Fermi surface that is closer to a circle. Following the general arguments given above, we conclude that the high energy data indicates the presence of stronger electron correlation in the bulk as compared to the surface. This result is surprising since any difference in the strength of electron correlations between bulk and surface is expected to be the opposite of what is observed here due to the reduced coordination at the surface. The reason for increased correlation in the bulk and the possible generalisation of the present result to other HTS compounds is still an open question.
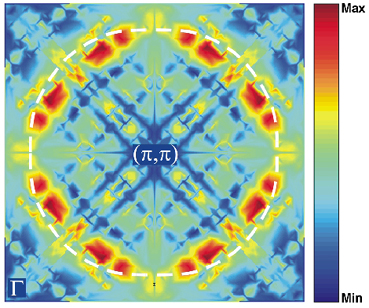 |
Fig. 127: The Fermi surface of Nd1.85Ce0.15CuO4 obtained by accumulating a large number of spectra similar to the one shown in Figure 126. The white dashed line indicates earlier low-energy results [1]. |
References
[1] N.P. Armitage, D.H. Lu, C. Kim, A. Damascelli, K.M. Shen, F. Ronning, D.L. Feng, P. Bogdanov, Z.-X. Shen, Y. Onose, Y. Taguchi, Y. Tokura, P.K. Mang, N. Kaneko and M. Greven, Phys. Rev. Lett. 87, 1472003 (2001).
Principal Publication and Authors
T. Claesson (a), M. Månsson (a), C. Dallera (b), F. Venturini (c), C. De Nadaï (c), N.B. Brookes (c), O. Tjernberg (a), Phys. Rev. Lett. 93, 136402 (2004).
(a) Laboratory of Materials and Semiconductor Physics, KTH, Stockholm (Sweden)
(b) INFM-CNR and Dipartimento di Fisica, Politecnico di Milano (Italy)
(c) ESRF
partners


European Synchrotron Radiation Facility - 71, avenue des Martyrs, CS 40220, 38043 Grenoble Cedex 9, France.