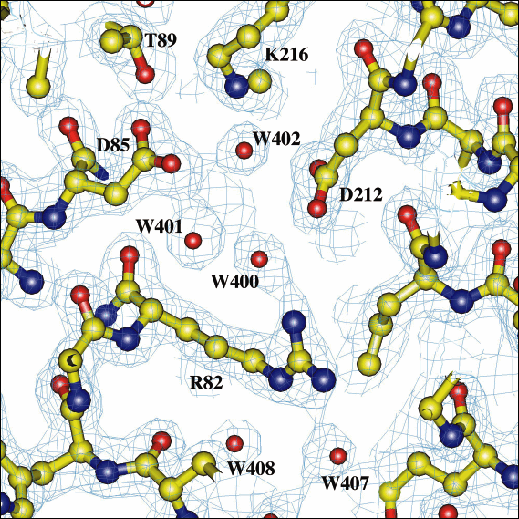
Figure 11
Fig. 11: Electron density map (2Fo-Fc, contoured at 1) in the vicinity of the Schiff base. The electron density map to 1.9 Å resolution is represented in blue, water molecules are represented as red spheres.
| back to: Studies on Bacteriorhodopsin |


