- Home
- Users & Science
- Scientific Documentation
- ESRF Highlights
- ESRF Highlights 2017
- Enabling technologies
- X-SOCS - software as a service opens new applications for nanostrain scanning
X-SOCS - software as a service opens new applications for nanostrain scanning
X-SOCS is a software developed at the ESRF to enable users to determine the strain and stress of their nanosamples. It allows non-expert users to analyse the huge data volumes produced during and after the experiment. X-SOCS is an example of how software is addressing the challenges of the Extremely Brilliant Source (EBS) project.
Software is a major factor for enabling users to get the most out of their data; developments in this field are therefore a relevant part of the EBS program. Within the frame of the Scientific Data Analysis and Data Management project, the ESRF has hired additional software engineers and data scientists to work on building a generic and sustainable platform for scientific software and to develop applications that are specific for scientific techniques. Thanks to funding from the NFFA (http://www.nffa.eu/) and IRT NanoElec (http://www.irtnanoelec.fr/en/) projects, a software engineer was hired to improve the X-SOCS [1] software on ID01 for doing X-ray strain scanning at the nanoscale.
X-SOCS aims at retrieving strain and tilt maps of nanostructures, films, surfaces or even embedded structures. It offers the opportunity to get rapid preliminary results, giving the user the opportunity to adapt the planning of the experiments and the measurements with respect to this first set of results. This is of particular importance for the application of such fast scanning methods to operando studies at high temperatures or in gas or liquid environments. The ultimate goal is to offer an easy-to-use tool for visualising strain, tilt and/or a composition map for nanosamples as a remote service for users, thus opening the technique up to new user communities and applications.
 |
|
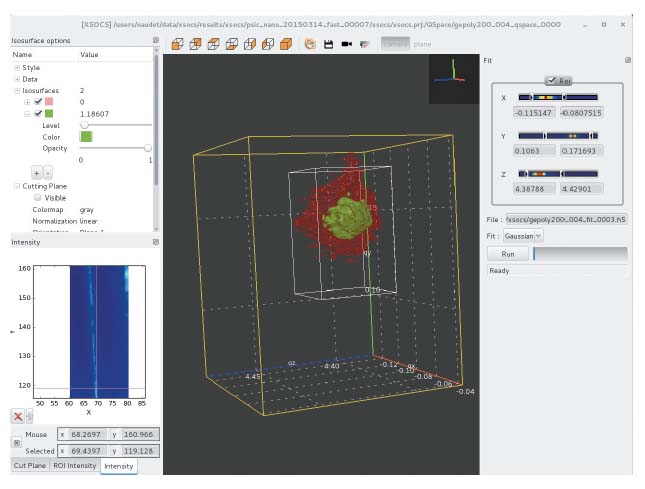
Fig. 148: X-SOCS graphical interface: 3D view of the reciprocal space (with 2 isosurfaces). |
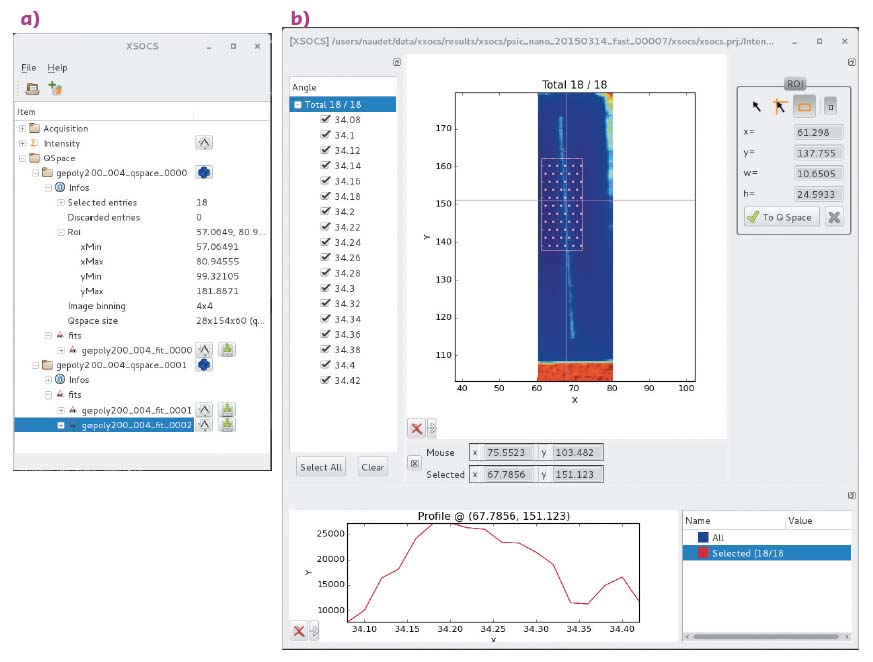
The first version of the software was written by beamline scientists and users. However, the software was not time-efficient, was difficult to maintain and lacked advanced 3D visualisation capabilities. The work of the software engineer was to address these points and make the X-SOCS program maintainable in the long term. This was done by adopting and building on the newly developed Silx library (https://www.silx.org/) and, in particular, its visualisation routines for reading and writing data in common data formats. Using this library, it was possible to have advanced 3D visualisation of reciprocal space, including the definition of regions of interest, in a very short time (see Figures 148 and 149). Being able to define such regions of interest during an experiment makes the analysis of the treated data easier and faster. Moreover, the 3D visualisation in reciprocal space gives access to information, hidden with the 2D visualisation tools in the initial version of the software. The efficiency of the data manipulation was improved by two orders of magnitude by restructuring the code to make it more efficient, adopting HDF5 as data format and using a multi-threaded approach. The first step in the data reduction now takes minutes instead of hours. The new program is available on the ESRF cluster and for downloading, and the source code is available under an Open Source licence to facilitate contributions from other institutes. The next step is to make X-SOCS available as a remote service.
 |
|
Fig. 149: X-SOCS: a) Workspace view and b) acquired intensity view / ROI selection. |
The success of this project has been strongly appreciated by the ID01 user community and, in the words of the beamline scientist, it is “a real game changer for ID01 as a user facility”. This project shows that by investing in software development major improvements can be made in user experience.
Authors
D. Naudet, G. Chahine, M-I. Richard, T. Vincent, V.A. Sole, T. Schulli and A. Götz. ESRF
References
[1] G.A. Chahine et al., J. Appl. Cryst. 47, 762-769 (2014).
partners


European Synchrotron Radiation Facility - 71, avenue des Martyrs, CS 40220, 38043 Grenoble Cedex 9, France.