- Home
- Users & Science
- Scientific Documentation
- ESRF Highlights
- ESRF Highlights 2007
- High Resolution and Resonance Scattering
- Phonons at the Fe (110) surface
Phonons at the Fe (110) surface
The fascinating development of nanoscale science requires a precise understanding of dynamical and thermodynamical properties of surfaces and nano-objects. What are the surface modifications of the phonon dynamics with respect to the bulk? How “thick” from the thermodynamical point of view is a surface? These key-questions have been addressed theoretically [1] but experimental verification using surface sensitive methods [2] did not allow direct measurements of the phonon density of states (DOS) on a clean surface. Recent developments at beamline ID18 have enabled the phonon spectroscopy of monolayer films and nanostructures using in situ nuclear inelastic scattering (NIS) [3]. The method gives phonon DOS which is (i) partial -only atoms of the resonant isotope contribute- and (ii) projected onto the direction of the incident photons. The contributions of various branches are weighted by the squared projection of the phonon polarisation vector to the incident photon’s direction [3].
We measured phonon DOS for single atomic monolayers at and near a clean Fe(110) surface. The samples were single-crystalline Fe(110) films epitaxially grown on W(110) crystal, where the chosen atomic monolayers were filled with the resonant 57Fe isotope, while the rest of the film was composed of the non-resonant 56Fe atoms. Using a special preparation protocol, the 57Fe monolayers could be precisely located at the surface (referred as “S”), one atomic layer below the surface (referred as “S-1”) and deeper (“D”). Due to the ideal isotope selectivity of nuclear resonant scattering, this approach gives the resolution of a single atomic layer in a chemically homogeneous crystal. Moreover, a combination of the grazing-incidence coherent nuclear scattering (NRS) and incoherent NIS provided the direct correlation between electronic (including magnetic) and phononic properties. The measurements were performed at room temperature with the X-ray beam along both high-symmetry directions of the 2-dimensional rectangular unit cell of the Fe(110) surface, i.e. along [001] and [![]() ].
].
 |
|
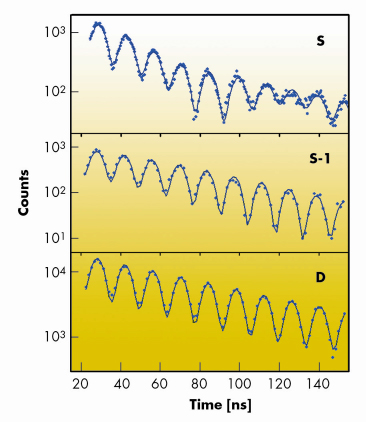
Fig. 11: Fitted NRS time spectra for the Fe(110) surface (S), subsurface (S-1), and deep (D) layers measured with the X-ray beam along the [ |
Figure 11 shows the time spectra of coherent grazing-incidence nuclear scattering measured with the X-ray beam along the [![]() ] direction. The spectra of (S-1) and (D) show a single frequency quantum beat pattern described by a well-defined hyperfine magnetic field Bhf oriented parallel to the beam, i.e. along the [
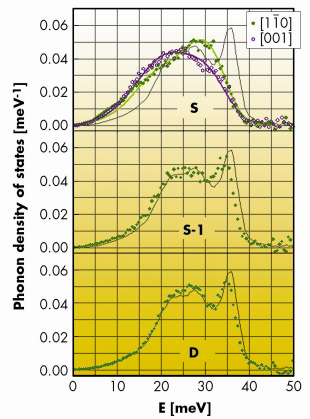
] direction. The spectra of (S-1) and (D) show a single frequency quantum beat pattern described by a well-defined hyperfine magnetic field Bhf oriented parallel to the beam, i.e. along the [![]() ] direction, in contrast to the [001] easy magnetisation axis in bulk Fe. The surface (S) spectrum is clearly different by an additional intensity modulation, which results from a finite electric field gradient caused by the termination of ionic and electronic charges at the surface. Along with the electronic properties, the vibrational ones are also subjected to a strong modification. Figure 12 shows the DOS extracted from the measured energy dependencies of incoherent NIS. The DOS of the first surface monolayer (panel S) is very different from those of two other samples, as well as from the DOS of the bulk iron. The most striking anomalies are the suppression of the phonon peak at 35 meV and a considerable enhancement of vibrational states below 15 meV. In addition, the DOS projected onto the [
] direction, in contrast to the [001] easy magnetisation axis in bulk Fe. The surface (S) spectrum is clearly different by an additional intensity modulation, which results from a finite electric field gradient caused by the termination of ionic and electronic charges at the surface. Along with the electronic properties, the vibrational ones are also subjected to a strong modification. Figure 12 shows the DOS extracted from the measured energy dependencies of incoherent NIS. The DOS of the first surface monolayer (panel S) is very different from those of two other samples, as well as from the DOS of the bulk iron. The most striking anomalies are the suppression of the phonon peak at 35 meV and a considerable enhancement of vibrational states below 15 meV. In addition, the DOS projected onto the [![]() ] and [001] directions are clearly different, which is unusual for the cubic lattice. The observed anomalies of atomic dynamics are strongly localised within the first atomic monolayer. Already in the second atomic layer (panel S-1) most of the bulk DOS features are restored and the deeper layers (panel D) display truly bulk behaviour. This striking observation that the surface is only one monolayer thick was convincingly confirmed by first principle phonon calculations [4] using density functional theory, which perfectly reproduced surface DOS and its anisotropy as depicted in Figure 12, panel S. Also dynamic and thermodynamic parameters (e.g. mean force constants, thermodynamic functions, mean square displacement) derived from the measured DOS are in good agreement with the theory.
] and [001] directions are clearly different, which is unusual for the cubic lattice. The observed anomalies of atomic dynamics are strongly localised within the first atomic monolayer. Already in the second atomic layer (panel S-1) most of the bulk DOS features are restored and the deeper layers (panel D) display truly bulk behaviour. This striking observation that the surface is only one monolayer thick was convincingly confirmed by first principle phonon calculations [4] using density functional theory, which perfectly reproduced surface DOS and its anisotropy as depicted in Figure 12, panel S. Also dynamic and thermodynamic parameters (e.g. mean force constants, thermodynamic functions, mean square displacement) derived from the measured DOS are in good agreement with the theory.
 |
|
Fig. 12: Measured phonon DOS for the surface (S), subsurface (S-1), and deep (D) layers near the Fe(110) surface projected onto the [ |
Besides the new insight in the field of surface dynamics, the present work opens new perspectives for nuclear inelastic scattering experiments in systems for even lower dimensionality, such as nano-wires and nano-dots.
The work was performed in the framework of the 6 FP STRP project DYNASYNC.
References
[1] R. Heid and K.-P. Bohnen, Phys. Rep. 387, 151 (2003).
[2] J. P. Toennies, in Surface Phonons, edited by W. Kress and F.W. deWette, Springer Series in Surface Sciences Vol. 21 (Springer, Berlin, 1991), p. 111.
[3] R. Röhlsberger, Nuclear Condensed Matter Physics with Synchrotron Radiation, Springer Tracts in Modern Physics Vol. 208 (Springer-Verlag, Berlin, 2004).
[4] K. Parlinski, Phys. Rev. B 74, 184309 (2006).
Authors
T. Ślęzak (a), J. Łażewski (b), S. Stankov (c), K. Parliński (b), R. Reitinger (d), M. Rennhofer (d), R. Rüffer (c), B. Sepiol (d), M. Ślęzak (a), N. Spiridis (b), M. Zając (a), A. I. Chumakov (c), and J. Korecki (a, b).
(a) AGH University of Science and Technology, Kraków (Poland)
(b) Polish Academy of Science (Poland)
(c) ESRF
(d) University of Vienna (Austria)
partners


European Synchrotron Radiation Facility - 71, avenue des Martyrs, CS 40220, 38043 Grenoble Cedex 9, France.