- Home
- Users & Science
- Scientific Documentation
- ESRF Highlights
- ESRF Highlights 2005
- X-ray Absorption and Magnetic Scattering
- Quantum Tunneling Diffusion of Cr Adatoms on Au(111)
Quantum Tunneling Diffusion of Cr Adatoms on Au(111)
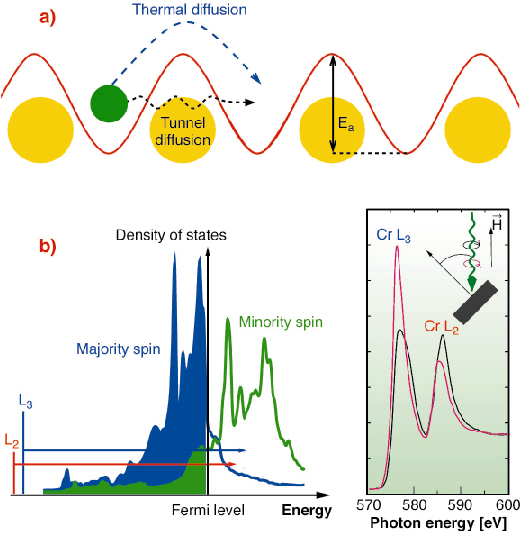
A classical particle in a potential well is trapped unless it gains enough energy to overcome the surrounding energy barrier. For adatoms adsorbed on surfaces, common temperature conditions generate lattice vibrations allowing the adatom surface diffusion. Conversely, at very low temperature, the particle motion is blocked. However, quantum mechanics allows a particle to tunnel through a potential barrier (Figure 115a), provided its de Broglie wavelength is comparable to the barrier width [1]. Quantum tunneling has so far been observed for light particles such as alpha emitters or surface hydrogen adatoms [2]. For heavier particles, with a smaller de Broglie wavelength, drastic conditions are necessary to observe quantum tunneling. Adatom clustering at low temperature may fulfil these requirements, provided the energy activation barrier, the barrier width (adsorption site separation) and the adatom mass are chosen accordingly.
Upon clustering, charge transfer and hybridisation lead to distinct changes in the electronic structure which can be determined using X-ray Absorption Spectroscopy (XAS) or better, X-ray Magnetic Circular Dichroism (XMCD), which measures the difference between two absorption spectra recorded with opposite X-ray helicities. XMCD involves selection rule governed transitions from core levels to unoccupied states just above the Fermi level (Figure 115b), which are highly sensitive to the local atomic coordination. Whereas isolated 3d adatoms exhibit multiplet peaks in the L2,3 XMCD spectrum, coordinated atoms exhibit broader band structure features [3].
 |
|
Fig. 115: (a) Adatom in a surface potential well. The particle may overcome the energy barrier either by thermal activation or by quantum tunneling. Ea is the energy barrier. (b) Electronic calculations of the density of states for a Cr monolayer on Au(111); Cr L2,3 core-level transitions are represented (arrows) and the XAS absorption spectra are displayed for left and right circularly polarised light. A magnetic field parallel to the photon beam is applied. The XMCD signal is the difference of the two spectra. |
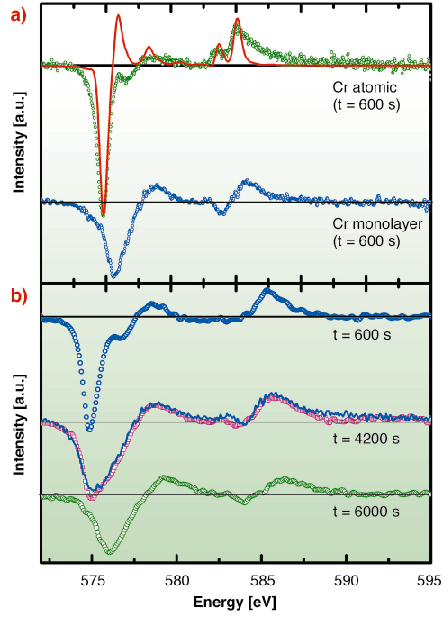
Deposition of a small amount of Cr (1% of a monolayer) on Au(111) at 10 K leads to a collection of isolated adatoms, giving a specific XMCD spectrum, different from that obtained for a Cr monolayer (Figure 116a). Upon diffusion, the adatoms aggregate mainly into dimers and trimers (as shown by Monte Carlo simulations) within a timescale of hours. These clusters already present an XMCD spectrum shape identical to the one obtained for a monolayer. The XMCD spectrum therefore evolves with time, and it can be decomposed in two components: atomic and “bulk-like” (Figure 116b). Hence, one can deduce the proportion of isolated adatoms as a function of time, and compare it to a Monte Carlo simulated evolution. The scaling between the number of Monte Carlo steps and the experimental evolution, allows us to determine the diffusion jump rate. Above 40 K, the jump rate increases dramatically and is no longer measurable. For this system, 40 K is the onset of the thermally activated diffusion. We determine an energy barrier of ~ 100 meV, in excellent agreement with our theoretical calculation. Below 40 K, the tunnel jump rate is orders of magnitude larger than the one expected from an Arrhenius law for thermal diffusion and it is nearly temperature independent. This is a hallmark of quantum tunneling.
In summary, the sensitivity of XMCD to the atomic coordination was used to study low-temperature diffusion of Cr adatoms on Au(111). The time evolution analysis of the XMCD spectra via Monte Carlo simulations allowed the determination of surface diffusion jump rates. For T < 40 K, where the classical description of thermal diffusion forbids adatom motion, the diffusion of Cr atoms is observed over a timescale of several hours. This extremely fast diffusion, nearly temperature independent, is attributed to quantum tunneling.
 |
|
Fig. 116: (a) Cr L2,3 XMCD spectrum for a collection of isolated atoms (top) and for a full monolayer. The red curve is a multiplet calculation for a d5 electronic configuration. (b) Time evolution of the XMCD spectrum for a collection of initially isolated atoms. |
These measurements were possible thanks to the fast data collection at ESRF (ID08 beamline): an XMCD spectrum is obtained within 5 minutes, even for such low amounts of material.
In memory of Kenneth Larsson
References
[1] See e.g. E. Merzbacher, Quantum Mechanics (Wiley 1998)
[2] A. Yazdani, Nature 409, 471 (2001)
[3] Gambardella et al., Phys. Rev. Lett. 88, 047202 (2002).
Principal publication and Authors
P. Ohresser (a), H. Bulou (b), S.S. Dhesi (c), C. Boeglin (b), B. Lazarovits (d), E. Gaudry (e), I. Chado (f), J. Faerber (b), F. Scheurer (b), Phys. Rev. Lett. 95, 195901 (2005) .
(a) Synchrotron SOLEIL, Gif-sur-Yvette (France)
(b) IPCMS – UMR7504, Strasbourg (France)
(c) Diamond Light Source (United Kingdom)
(d) Center for Computational Materials Science, Vienna (Austria)
(e) LMCP, Paris (France)
(f) Physikalisches Institut, Würzburg (Germany)
partners


European Synchrotron Radiation Facility - 71, avenue des Martyrs, CS 40220, 38043 Grenoble Cedex 9, France.