- Home
- Users & Science
- Scientific Documentation
- ESRF Highlights
- ESRF Highlights 2005
- Materials Science
- Alternating Sequence of Ring and Chain Structures in sulfur at High Pressure and Temperature
Alternating Sequence of Ring and Chain Structures in sulfur at High Pressure and Temperature
The behaviour and structure of sulfur under high pressure and temperature conditions is currently the subject of a renewed research effort [1,2]. However, there still exist disparities between the data and interpretations of results coming from the use of different techniques. In view of this, we have reinvestigated the structures of sulfur formed though direct transformation at pressures between 6 – 11 GPa and from room temperature to 1000 K. Over this same pressure range, in experiments conducted at room temperature, there is spectroscopic evidence for the existence of both non-molecular helical sulfur and a molecular S6 forms of sulfur, yet even the most recent diffraction experiments, also conducted at room temperature, show no evidence for any such structures in sulfur at pressures exceeding 25 GPa.
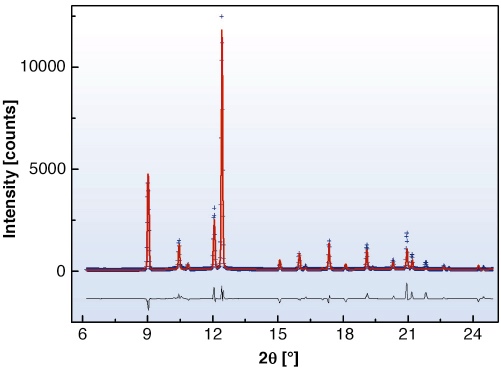
In conducting our experiments, we have encountered the non-molecular forms of sulfur previously observed as trigonal helical by Crichton et al. [1] and tetragonal helical by Fujitsa et al. [2]. In addition, we observe an intermediate structure, which does transform reversibly and is described as identical to the molecular S6 form that can be prepared by chemical methods at ambient conditions. The positions of the transitions from trigonal-S6 and S6-tetragonal structures have been delineated. Rietveld refinement of data collected in situ at 7.2 GPa and 950 Kelvin (Figure 33), with the Paris-Edinburgh large volume press, resulted in an R-3 symmetry, with 18 atoms per unit cell located at x = 0.17581(5), y = 0.19250(5) and z = 0.15027(5). This results in an S-S bond length of 2.1762(1) Å and torsion angle of 78.82º. The existence of this S6 phase is important as it shows directly that the S6 phase can only be observed, via direct transformation, at high temperature. Therefore, it explains why X-ray diffraction experiments conducted at room temperatures are unable to confirm the results of several independent Raman measurements.
 |
|
Fig. 33: Diffraction pattern of the S6 rhombohedral phase. Refinement results on the diffraction pattern obtained from in situ measurements at 7.2 GPa and 950 K; the data are represented by blue crosses, the red line corresponds to the Rietveld refinement and the black line to the difference between the observed and calculated data. |
Given that the temperatures that we have observed the transitions to trigonal, S6 and tetragonal phases are too high for Raman lasers to induce, and that there is also evidence that if sulfur is illuminated with weak laser light no transition is observed up to at least 10 GPa, other mechanisms must be proposed for the Raman observations. Considering the pressure dependent red shift of the optical absorption edge of the S8 molecule, Eckert and Steudel [3] explain the room temperature S8 to trigonal phase transition, only observed in Raman studies, suggesting that the absorption of laser light can furnish the activation energy necessary to break the S8 molecules promoting polymerisation to, for example, the trigonal helical phase. This mechanism is further complicated by the fact that the optical absorption can change with pressure and at each phase transition. Nonetheless, within this framework of laser-induced transition it is also noted that the sequence S8 ![]() polymeric
polymeric ![]() S6 observed by Raman spectroscopy at room temperature corresponds to the same sequence observed by X-ray diffraction at high temperature and in the same pressure range. This indicates that, the photo-induced phase transitions observed by Raman measurements correspond to existing structural transitions in the phase diagram. It is most likely that the effect of suitable laser illumination and temperature is to induce these transitions by overcoming the high kinetic barrier related to the breakdown of the S8 molecule.
S6 observed by Raman spectroscopy at room temperature corresponds to the same sequence observed by X-ray diffraction at high temperature and in the same pressure range. This indicates that, the photo-induced phase transitions observed by Raman measurements correspond to existing structural transitions in the phase diagram. It is most likely that the effect of suitable laser illumination and temperature is to induce these transitions by overcoming the high kinetic barrier related to the breakdown of the S8 molecule.
With regard to other members of the Group VI elements, it is now clear that the structure S6 described here is similar to that of Se6; a phase that metalises at high pressure. In sulfur, Brazhkin et al. [4] describe metalisation of liquid sulfur at a pressure of 8 GPa, around a maximum in the melting curve, indeed in the region where we observe the solid S6 phase. Considering this, it would be interesting to look at the structure of the liquid in this region, to identify whether the liquid has a molecular nature like the solid phase below the melting curve.
References
[1] W.A. Crichton, G.B.M. Vaughan and M. Mezouar, Z. Kristallogr. 216, 417-419 (2001).
[2] H. Fujihisa, Y. Akahama, H. Kawamura, H. Yamawaki, M. Sakashita, T. Yamada, K. Honda and T. Le Bihan, Phys. Rev. B 70, 134106 (2004).
[3] B. Eckert and R. Steudel, Topics in Current Chemistry 231, 31-98 (2003).
[4] V.V. Brazhkin, S.V. Popova and R.N. Voloshin, Physica B 265, 64-71 (1999).
Principal Publication and Authors
L. Crapanzano, W.A. Crichton, G. Monaco, R. Bellissent and M. Mezouar, Nature Materials 4 550-552 (2005).
ESRF
partners


European Synchrotron Radiation Facility - 71, avenue des Martyrs, CS 40220, 38043 Grenoble Cedex 9, France.