- Home
- Users & Science
- Scientific Documentation
- ESRF Highlights
- ESRF Highlights 2000
- Soft Condensed Matter
- Inverse Melting in Polymers
Inverse Melting in Polymers
Melting is a familiar process which is not expected to show unusual behaviour except for the cases of ice and bismuth. The density of ice is lower than water and thus ice expands during crystallisation - instead of contracting like most other materials. Ice also shows an inversion in melting temperature with increasing pressure, this unusual behaviour being attributed to the loose crystal packing of water molecules due to hydrogen bonding. It is also reported that below the glass transition temperature, on compression, the initially crystalline hexagonal phase of ice transforms into a new high-density amorphous phase [1].
Using time-resolved X-ray diffraction at ID2 and ID11, ESRF, effects similar to those seen in ice have been observed upon applying pressure to several polymeric systems which have a loose chain packing within the crystals. A brief summary of the unusual phase behaviour observed in a one-component system, the polymer poly-4-methyl pentene-1 (P4MP1), will be reported here.
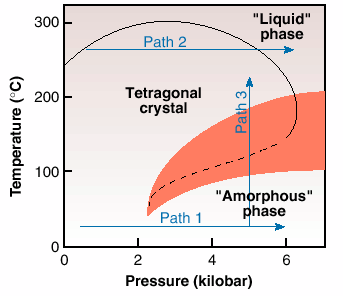
P4MP1 is a semi-crystalline polymer, having a crystalline component of nearly 60%. On crystallisation from the melt at atmospheric pressure, chains in the 72 helical conformation pack in the tetragonal phase [2,3]. Below the glass transition temperature, the crystal density of the polymer is lower than the amorphous. Similarly to the observations for ice, on compression along Path 1, Figure 36, the initially crystalline tetragonal phase loses order and seemingly becomes "amorphous" above a threshold value of 2 kbar. This phenomenon of "solid state amorphisation" is in agreement with the unusual density relationship below the glass transition temperature of the polymer. This transformation is exothermic in nature [3], thus suggesting that the "amorphous" phase has a lower entropy than the crystalline tetragonal phase.
 |
Fig. 36: A simplified phase diagram of a polymeric system, poly-4-methyl pentene 1, based on the structural and calorimetric results [2]. The transition between the tetragonal and amorphous phases (dashed line) has been detected in calorimetric experiments by measurements taken under increasing pressure along two paths 1 and 2, and on heating/ cooling along path 3. (The shaded region represents the appearence of the hexagonal phase).
|
A normal density relationship exists between the crystal and the amorphous phases on heating at atmospheric pressure, above the glass transition temperature, as the density of the crystal becomes greater than that of the amorphous phase. With increasing pressure following Path 2, Figure 36, just below the melting point, the anticipated increase in melting temperature with pressure is observed initially. But after reaching a maximum value, the melting temperature decreases with increasing pressure. This inversion in the melting temperature suggests an inversion in the density relationship of the crystalline and amorphous phases, above a maximum value of pressure in the pressure-temperature phase diagram [2].
The observation of inverse melting suggests the possibility of a re-entrant of the two widely separated "liquid" and "amorphous" phases in the pressure-temperature phase diagram. To confirm this, experiments were performed along Path 3, Figure 36. A disordering on cooling of the crystalline tetragonal phase, that is inverse melting, and crystallisation on heating were observed. The structural changes have also been confirmed by calorimetry. Unfortunately, at relatively high-pressures, the observation of the re-entrant of the "liquid" and "amorphous" phases is hampered because of the appearence of a new crystalline phase, the hexagonal phase, shown by shaded region in the phase diagram. However, if one examines the "amorphous" phase, or amorphous halo, observed in all the diffraction patterns, it is found to be structurally continuous with the "liquid" during the appearance of the hexagonal phase [3].
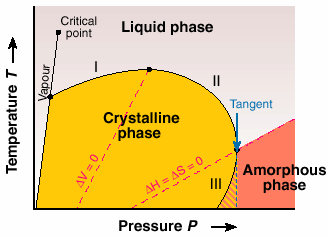
The underlying thermodynamics in the proposed phase diagram lead us to the classic work of the great inorganic chemist Gustav Tammann, reported in the book Kristallisieren und Schmelzen (1903). In the proposed universal phase diagram, Figure 37, he suggested the possibility of inverse melting and re-entry of the two widely separated "liquid" and "amorphous" phases. Our work on P4MP1 is the first example that shows features similar to that anticipated by Tammann.
References
[1] O. Mishima, L.D. Calvert, E. Whalley, Nature 310, 393-395 (1984); Nature 314, 76-78 (1985).
[2] S. Rastogi, M. Newman, A. Keller, Nature 55, 353-355 (1991); J. Polym. Sci. B Polym. Phys. 31, 125-139 (1993).
[3] S. Rastogi, G.W.H. Höhne, A. Keller, Macromolecules 32, 8897-8909 (1999).
Author
S. Rastogi.
Eindhoven University of Technology (The Netherlands)


