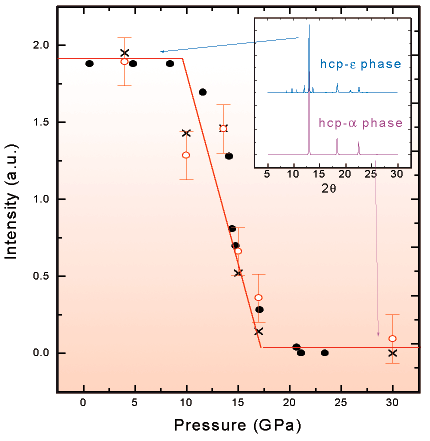
Figure 74
Fig. 74: Integrated intensity of the satellite of the Fe Kß line (open circles) compared to the -phase fraction determined by Mossbauer spectroscopy (Taylor et al., 1991) (solid circles) upon pressure increase. The later curve has been scaled to the low-pressure XES satellite intensity. The solid line is a guide to the eyes. The intensity of the XES satellite was calculated from the difference spectra obtained by subtracting the 230 Kbar spectrum from each scan. The plateau at low (high) pressure corresponds to the magnetic (non-magnetic) phase. The diffraction pattern measured in both phases, shown in the inset, confirms the structural change.
| back to: Magnetism and Structure: the Fe |


