Figure 84
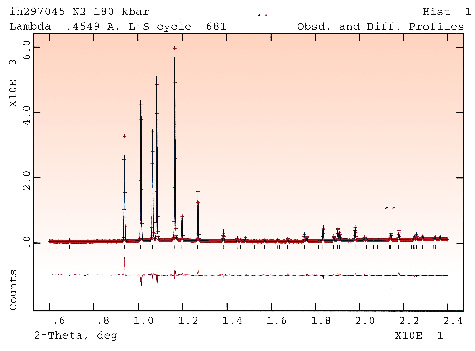
Fig. 84: Measured (red crosses) and calculated (blue line) diffraction pattern of N2 at 180 kbar. The ticks show the positions of the reflections allowed by symmetry. The difference between the measured and the calculated patterns is shown below the ticks.
partners


European Synchrotron Radiation Facility - 71, avenue des Martyrs, CS 40220, 38043 Grenoble Cedex 9, France.