- Home
- Users & Science
- Scientific Documentation
- ESRF Highlights
- ESRF Highlights 2008
- Methods and instrumentation
- In situ X-ray reflectometry can solve the phase problem
In situ X-ray reflectometry can solve the phase problem
X-ray reflectometry is widely used to determine the depth distribution of the dielectric constant in layered systems. This involves an inverse problem, where one attempts to infer the causes from observation of the effects. Solving it may be hampered by the ambiguity in the solution, essentially due to the absence of information about the phase of the amplitude reflectivity [1].
We have developed a method of exact phase retrieval that is applicable to a layered film for which the reflectivity has been measured in situ during growth. In the simplest case, the angle between the X-ray beam and the film surface is fixed, while, at a point t in time, both the reflectivity R(t) = |r(t)|2 and the derivative dR/dt are measured. In this case, both the real R[r(t)] and imaginary I[r(t)] parts of the amplitude reflectivity r(t), hence the phase, can be pinpointed exactly.
Using the first order differential equation describing the variation of the amplitude reflectivity with the film thickness we deduced the following accurate equation to describe the variation of the reflectivity with time dR/dt = A(q, f, R) R[r(t)] + B(q, f, R) I[r(t)] (Eq. 1), where A and B are real functions that do not explicitly contain the film’s parameters. They only depend on the reflectivity R(t) and on the incident flux of particles q(t) and their chemical composition via the complex atomic scattering factor f(t). q and f can vary with time. When performing in situ reflectivity measurements R and dR/dt are known so that Eq. (1) is no longer a differential equation for the function R(t). As a linear algebraic equation for the real and imaginary parts of the amplitude reflectivity, Eq. (1) can now be solved together with the obvious relation R(t) = {R[r(t)]}2 + {I[r(t)]}2 (Eq. 2) to determine both R[r(t)] and I[r(t)] directly from the experimental data, without using any model for describing the reflection from the media.
Thus, knowing R and dR/dt at a point t in time we determine the phase of the reflected wave at the same point, i.e., the phase can be found without any knowledge of the pre-history of the structure growth, and independent of the chemical composition inside the structure, the presence of interlayers, and of the substrate composition. The equation was deduced while making two important assumptions: (a) the material polarisability is proportional to the density, and (b) the dielectric permeability inside the film remains unchanged.
 |
|
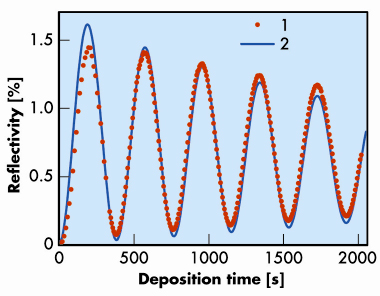
Fig. 156: Reflectivity versus deposition time from a growing tungsten film measured at an X-ray energy of 17.5 keV and with a grazing angle |
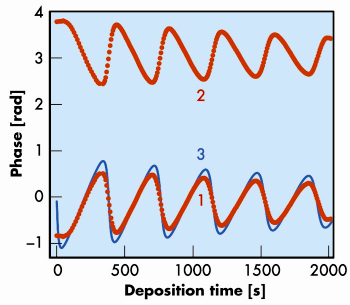
The reflectivity (17.5 keV X-ray energy, 0.5° grazing angle) measured in situ at the BM05 beamline [2] during the growth of a tungsten film on a Si substrate is shown in Figure 156. The incident flux q = 7.26 x 10¹³ atom/cm2/s results in a typical growth rate of 12 pm/s. The measurements were performed every 7 s which corresponds to an increase of the film thickness of about 80 pm, equivalent to one third of a monolayer of tungsten. The phase of the amplitude reflectivity extracted from the experimental curve R(t) is presented in Figure 157. As Eq.(2) has a quadratic form, there are two possible solutions for the phase retrieval problem (red curves 1 and 2). Curve 3 in Figure 157 and curve 2 in Figure 156 were calculated using the simplest model possible, i.e., assuming a constant film density with depth. Since curves 1 and 3 in Figure 157 are close to each other, we selected curve 1 as the solution to the phase retrieval problem. Nonetheless, both the reflectivity and the phase inferred from the experimental data differ noticeably from the model calculation, suggesting that this simplest model is not fully correct.
 |
|
Fig. 157: Solutions of the phase retrieval problem (curves 1 and 2) found directly from the experimental curve shown in Figure 156. Curve 3 shows the phase evolution calculated assuming a uniform tungsten film with constant density. For illustrative purpose, we assumed the phase to vary within the [– |
We also reconstructed the depth-distribution of the tungsten density using the approach described in [1], which is based on the analysis of the angular dependence of the reflectivity measured after deposition of a 24.6 nm thick film. Two particular features can be clearly observed on the density profile: (a) the reduced density as compared to bulk tungsten in a region about 2 nm thick near the substrate and (b) the exponential decrease of tungsten concentration over a depth of about 1 nm within the Si substrate, probably caused by diffusion and implantation processes. These two features permit a complete explanation of both the reflectivity and the phase curves.
In the future, we plan to investigate the possibility of performing a complete angular reflectivity curve R(Θ, t) instead of a single angular value at any point in time. That would allow us to find the phase versus angle, to solve the inverse problem of X-ray reflectometry more correctly, and to analyse the variations of the dielectric constant profile with time.
Principal publications and authors
I. Kozhevnikov (a), L. Peverini (b) and E. Ziegler (b), Optics Express, 16, 144 (2008); J. Appl. Phys, 104, 054914 (2008).
(a) Institute of Crystallography, Moscow (Russia)
(b) ESRF
References
[1] I.V. Kozhevnikov, Nucl. Instrum. Methods A 508, 519 (2003).
[2] L. Peverini, E. Ziegler, T. Bigault, I. Kozhevnikov, Phys. Rev. B 72, 045445 (2005).
partners


European Synchrotron Radiation Facility - 71, avenue des Martyrs, CS 40220, 38043 Grenoble Cedex 9, France.