- Home
- Users & Science
- Scientific Documentation
- ESRF Highlights
- ESRF Highlights 2008
- Materials science
- Direct observation of 3D grain growth in Al-0.1%Mn
Direct observation of 3D grain growth in Al-0.1%Mn
Metals and alloys are typically polycrystalline and are processed by plastic deformation and annealing. During annealing the so-called grain growth process may occur, whereby some of the grains in the polycrystalline ensemble grow at the expense of others, resulting in a coarsening of the microstructure. This has important implications for the properties of the material; widely known applications are transformer steels and devices for power current based on Tc superconductor compounds. Grain growth has been studied extensively for decades both experimentally - mostly by optical microscopy - and theoretically, leading to the proposition of a range of grain growth models.
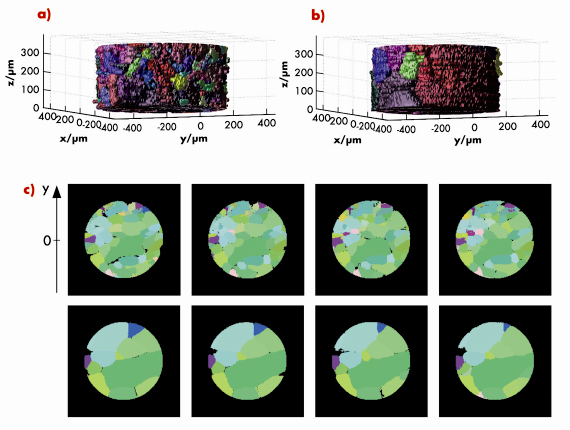 |
| Fig. 25: a) 3D grain map after first annealing for an Al-0.1%Mn alloy. b) the same volume is shown after the final annealing. c) the four layers in the middle of the volume are shown after the first annealing, top row, and final annealing, bottom row, respectively. The interlayer spacing is 10 µm. Colours symbolise crystallographic orientation. Black denote vacancies; internal vacancies being an artefact of the program. The pixel size in the maps is 5 µm x 5 µm. |
Here we present a 3D mapping study of an Al-0.1%Mn alloy using the three-dimensional X-ray diffraction (3DXRD) microscope situated at the material science beamline ID11. As a function of the treatments, the average grain volume increases from 2.9 x 105 µm3 to 4.2 x 105 µm3 and the number of grains within the illuminated part of the sample reduces from 483 to 32, see Figure 25. The volume distribution of the initial grains is shown in Figure 26a. Marked in red are the 27 grains that remained after annealing. As expected these are predominantly the larger grains. Notably three grains smaller than the median size were also observed to grow. As illustrated in Figure 26b the texture of both the initial and the final distributions are close to random. Hence, within the statistics of the study, no apparent correlation is found between orientation and the probability of growth. To our knowledge, for the first time a bulk sample has been completely characterised before and after a set of annealing treatments.
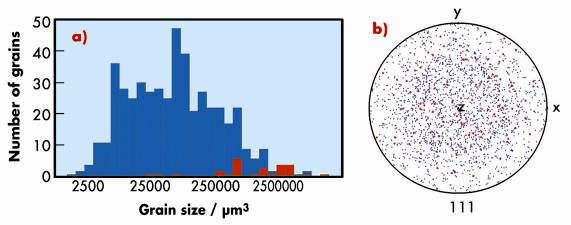 |
| Fig. 26: Characteristics of grains. a) Grain volume distribution before annealing. Red colour: the sub-set of grains remaining after the annealing; blue colour: all other grains. b) (111)-polefigure with respect to sample reference system (x,y,z). Same colour scheme as for a). |
Principal publication and authors
S. Schmidt (a), U.L. Olsen (a), H.F. Poulsen (a), H.O. Sørensen (a), E.M. Lauridsen (a), L. Margulies (a,b), C. Maurice (c) and D. Juul Jensen (a), Scripta Mater. 59, 491 (2008).
(a) Center for Fundamental Research: Metal Structures in Four Dimensions, Risø National Laboratory at the Technical University of Denmark, Roskilde (Denmark)
(b) ESRF
(c) Materials centre, Ecole des Mines, Saint Etienne (France)
partners


European Synchrotron Radiation Facility - 71, avenue des Martyrs, CS 40220, 38043 Grenoble Cedex 9, France.