- Home
- Users & Science
- Scientific Documentation
- ESRF Highlights
- ESRF Highlights 2007
- Surface and Interface Science
- Identifying active sites in zeolites
Identifying active sites in zeolites
Zeolites are widely used materials with a very wide range of applications. They are employed in almost every household in laundry detergents and as catalysts in industry such as petrochemical refining; they are also used as air and water purifiers, and as specific absorbents in agriculture. With natural zeolites being discovered more than 200 years ago, intensive research is nowadays aimed at developing new, artificial zeolites with tailored properties for specific tasks.
Active sites are created in the zeolite unit cell when tetrahedrally-coordinated silicon atoms, which are located on the so-called crystallographic T sites, are replaced by trivalent aluminium atoms. Besides the size of its pores, the performance of zeolites is determined by the occupation of specific T sites by aluminium. A zeolite structure database was created [1] by combining the results of many different experimental methods. However, the distribution of Al over the crystallographic T sites has remained unknown for many zeolites. This is seriously hampering the understanding of the function of some technologically important zeolites and hindering the development of further zeolites with new functionalities.
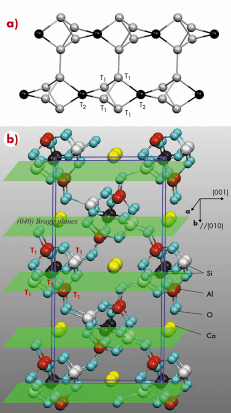
To determine the aluminium occupation of T sites in zeolites directly, we used the X-ray standing wave (XSW) technique. The well-known zeolite, scolecite, was chosen as an example. Scolecite exhibits the natrolite structure (Figure 93a) with the composition |Ca4(H2O)12| [Si12Al8O40]. The calcium cation, which is compensating the charge produced by the trivalent Al, is loosely bound and can be exchanged easily. Figure 93b depicts the atomic structure of scolecite based on a previous refinement using neutron and X-ray diffraction data [2]. The sample used in the present experiment was a natural crystal and originated from Pune, India. The Si/Al atomic ratio was determined by energy dispersive X-ray spectroscopy as 3:2.
 |
|
Fig. 93: a) Six of the building units of scolecite, which form a natrolite chain. The spheres represent the five T sites, four T1 atoms and one T2, that are occupied by aluminium or silicon. Sticks represent the oxygen atoms that bridge the T sites. The pores of the zeolite are formed by oxygen atoms connecting T1 atoms of neighbouring chains. b) The atomic structure of the scolecite unit cell is marked by the blue rectangles with lattice parameters of a = 0.6522 nm, b = 1.8968 nm, c = 0.9840 nm, |
To determine the occupancy of the five T sites in question, we used the X-ray standing wave (XSW) technique at beamline ID32. The highly-collimated, focused 6.00 keV X-ray beam selected a small grain of sufficient crystalline quality from the mm-sized mosaic crystal. Three virtually orthogonal reflections, (-402), (002), and (040) (Figure 93b), with a lattice spacing of 0.163, 0.462 and 0.474 nm, respectively, were employed for the XSW measurements.
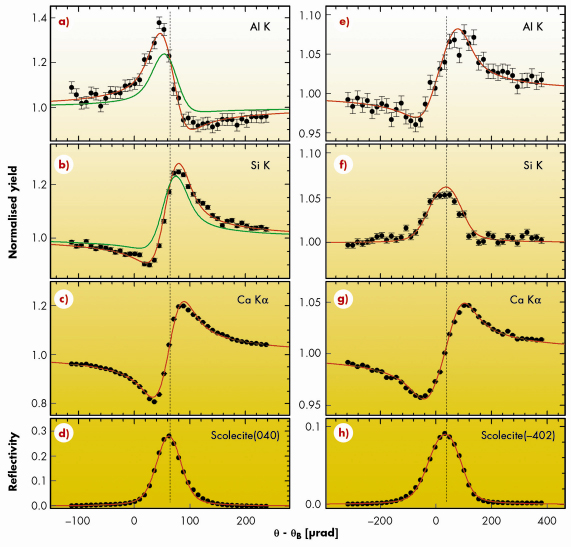
Using the atomic coordinates in Ref. [2] we calculated the Al, Si, and Ca yield for the selected reflections for different combinations of the occupation of the five crystallographic T sites by Al and Si. The resultant curves were compared with the experimental data, this is shown for two reflections in Figure 94. All measured fluorescence yield curves are well reproduced by the calculated ones based on the best fit for the placement of Al and Si (and the known atomic coordinates). The result reveals unambiguously that aluminium is positioned only on half of the T1 sites. If Al had occupied other positions, this would have been detected by a significant change in the yield curves shown in Figure 94.
 |
|
Fig. 94: The XSW-induced Al K, Si K, and Ca K |
References
[1] C. Baerlocher, W.M. Meier, D.H. Olson, Atlas of Zeolite Framework Types. Fifth Revised Edition, Elsevier, Amsterdam, 2001.
[2] J.V. Smith, J.J. Pluth, G. Artioli, F.K. Ross, Neutron and X-ray refinements of scolecite, Proc. 6th Int. Zeolite Conf. 842-850 (1984).
Principal publication and authors
J.A. van Bokhaven (a) , T.-L. Lee (b) , M. Drakopoulos (c) , C. Lamberti (d), S. Thiess (b,e), J. Zegenhagen (b).
(a) ETH Zurich (Switzerland)
(b) ESRF
(c) Diamond Light Source (UK)
(d) University Torino (Italy)
(e) University Hamburg (Germany)
partners


European Synchrotron Radiation Facility - 71, avenue des Martyrs, CS 40220, 38043 Grenoble Cedex 9, France.