Figure 70
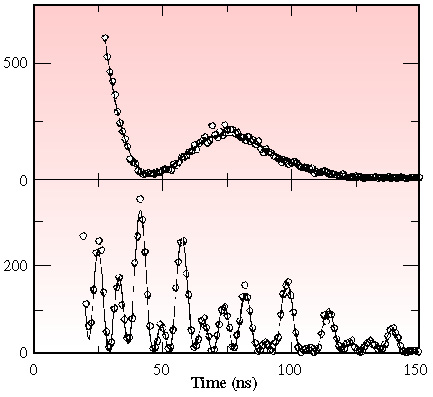
Fig. 70: Top panel shows a typical "non-magnetic" time response. The probe layer was 5 ML away from the interface layer. Bottom panel shows a typical 'magnetic' time response. The probe layer was 40 ML away from the interface layer.
partners


European Synchrotron Radiation Facility - 71, avenue des Martyrs, CS 40220, 38043 Grenoble Cedex 9, France.