Figure 109
 a)
a) b)
b) c)
c)
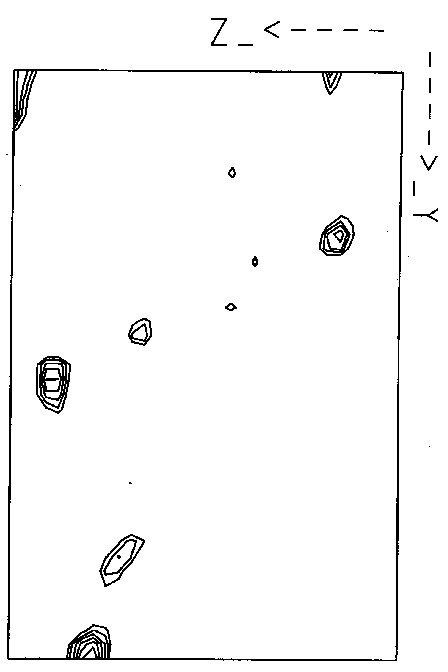
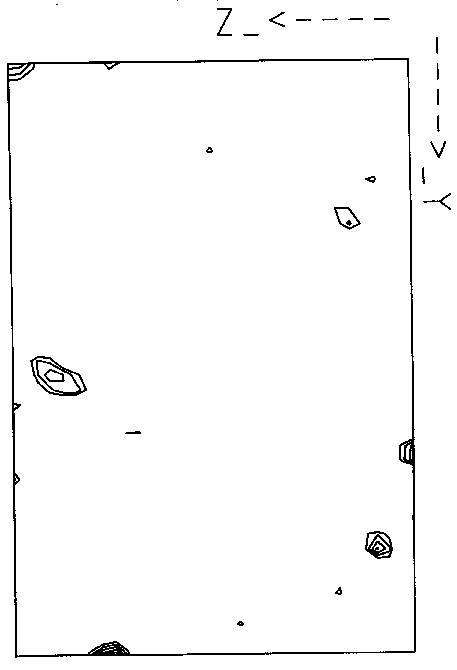
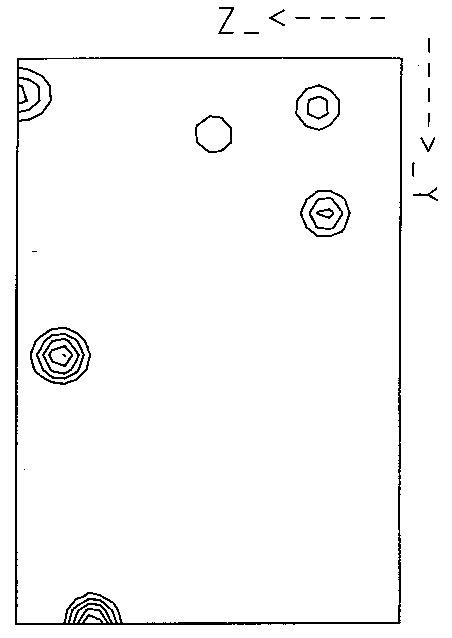
Fig. 109: Anomalous difference Patterson maps for diffraction data measured on (a) BM14 with the CCD at cryotemperature (b) SRS station 9.5 on image plate at room temperature and (c) as calculated from the selenium positions based on the MAD phased structure.


