- Home
- Users & Science
- Scientific Documentation
- ESRF Highlights
- ESRF Highlights 2017
- Structure of materials
- Zooming in on specific components of a working battery with operando XRD/PDF computed tomography
Zooming in on specific components of a working battery with operando XRD/PDF computed tomography
X-ray diffraction and pair distribution function computed tomography has been used to study the chemical structures of specific components in an operating battery in three dimensions, revealing the mechanism of a promising anode material. This work aims to improve the capacity and stability of batteries during many cycles of charge and discharge.
Sodium-ion batteries are a potentially important future energy storage technology. Sodium has similar chemistry to lithium and much of the established chemistry of lithium ion batteries can also be applied to sodium-ion batteries. Unfortunately, the graphite anodes used in lithium-ion batteries perform poorly with sodium, and other anode materials are required to produce sodium-ion batteries with good capacity and stability over many charge-discharge cycles. Alloying anode materials such as silicon, phosphorus, tin, antimony and bismuth offer very high capacities as they can capture several sodium ions for each anode atom [1]. Due to its low atomic weight, phosphorus offers the best gravimetric capacity, unfortunately its stability for battery cycling is poor. To understand the reasons for this, the chemical structure of the anode during battery cycling has been studied with operando pair distribution function and diffraction computed tomography (PDF/XRD-CT).
Phosphorus is a poor scatterer of X-rays and amorphous during most of the stages of battery cycling. This means that the normal tools of X-ray diffraction are of limited use. PDF-CT makes it possible to collect high quality PDF data on specific parts of the working battery without having to worry about background subtraction, which is one of the most problematic aspects of studying batteries with PDF methods [2]. Using beamline ID15A with a specially designed cell for battery tomography, 3D tomographic data were collected with high time resolution during cycling of the battery with a high enough energy to yield data that could be treated with both PDF and Rietveld analysis.
 |
|
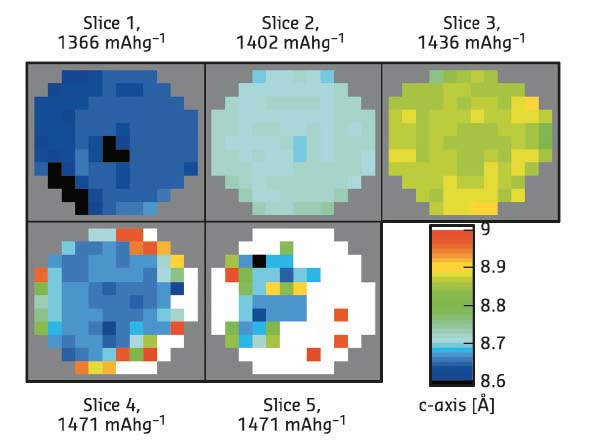
Fig. 119: Maps of selected tomographic slices from different heights in a phosphorus sodium-ion battery anode from Rietveld refinement. |
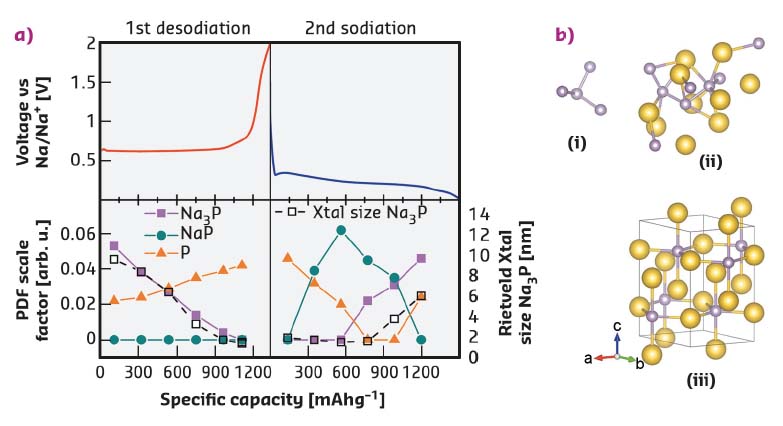
Comparison of the Rietveld and PDF fitting reveal that the charge and discharge of sodium in a phosphorus anode follow different structural routes and that even the crystalline phase appears first as an amorphous material. It was also possible to map the structural variation of the crystalline Na3P phase in the anode (Figure 119), using several real structural parameters (unit cell axes, crystallite size, Na site occupancy) extracted by the Rietveld method. The PDF data show the first clear evidence of a NaP nanocluster intermediate phase during sodiation (discharge). The structures present at all stages of cycling could be tracked by full fitting of all the possible phases to the PDF-CT data (Figure 120). Size variations at the nanoscale during cycling were clearly revealed in the PDFs: amorphous phosphorus exists in clusters of just four atoms during cycling, while the NaP forms in clusters of less than 10 Å radius.
 |
|
Fig. 120: a) Phases present in a phosphorus sodium-ion battery anode during cycling from PDF and Rietveld analysis. b) Structures: (i) nano-P cluster; (ii) nano-NaP cluster; (iii) crystalline Na3P. |
The observations fit well with calculations that indicate a thermodynamically controlled sodiation (discharge) mechanism and kinetically controlled desodiation (charge). The kinetic mechanism is favoured despite the high formation energy of the Na3–xP phases due to the high mobility of sodium in crystalline Na3P, which can maintain its layered structure as sodium is removed. During sodiation the thermodynamic path is followed through the lowest energy structures in the energy hull diagram calculated by Mayo et al. [3].
The chemical behaviour of a sodium-ion battery was determined from XRD/PDF-CT. Also, the expansion and contraction of the anode during cycling was revealed through a combination of XRD and absorption-CT. Knowing the different chemical and macro-structural stages that phosphorus passes through while alloying with sodium during battery operation will help provide a better understanding of the battery’s poor cycling stability.
Principal publication and authors
Chemical structures of specific sodium ion battery components determined by operando pair distribution function and X-ray diffraction computed tomography, J. Sottmann (a), M. Di Michiel (b), H. Fjellvåg (a), L. Malavasi (c), S. Margadonna (d), P. Vajeeston (a), G. B. M. Vaughan (b) and D. S. Wragg (a), Angew. Chem. Int. Ed. Engl. 56, 11385-11389 (2017); doi: 10.1002/anie.201704271.
(a) Department of Chemistry, University of Oslo (Norway)
(b) ESRF
(c) Department of Chemistry, University of Pavia and INSTM, (Italy)
(d) Department of Engineering, University of Swansea (UK)
References
[1] M.N. Obrovac et al., Chemical Reviews 114, 11444-11502 (2014).
[2] P.K. Allan et al., J. Am. Chem. Soc. 138, 2352-2365 (2016).
[3] M. Mayo et al., Chem. Mater. 28, 2011-2021 (2016).
partners


European Synchrotron Radiation Facility - 71, avenue des Martyrs, CS 40220, 38043 Grenoble Cedex 9, France.