- Home
- Users & Science
- Scientific Documentation
- ESRF Highlights
- ESRF Highlights 2013
- Structure of materials
- Pair distribution function computed tomography
Pair distribution function computed tomography
Recent times have seen the development of a number of X-ray analytical methods that enable the mapping of chemical and structural information from bulk objects in 3, 4 and even 5D [1]. Notably, this includes the development of X-ray diffraction computed tomography (XRD-CT) which allows a chemical and physical insight into solid-state chemistry processes as well as the mapping of physical parameters such as crystallite size [2,3]. However, obtaining quantitative structural information for nanoscale objects is a challenge since they lack crystalline order. The X-ray pair distribution function (PDF) method offers a way forward to obtain reliable, quantitative information on nanostructures. Here we demonstrate the successful coupling of pair distribution function analysis with computed tomography (CT) to yield the first data obtained by PDF-CT, enabling physicochemical profiling of the nano-properties of materials and their distribution in 3D space with micrometre resolution.
 |
|
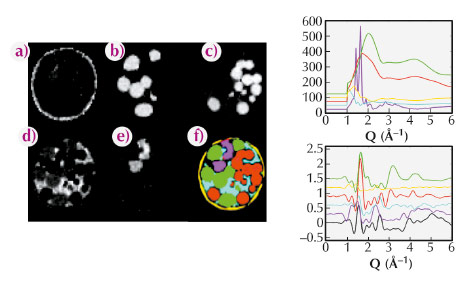
Fig. 124: (left) A-E distribution of KaptonTM (a), basalt (b), red (c), polystyrene (d) and PMMA (e) respectively, as determined by XRD-CT (top) and the PDF-CT (bottom). Shown in image (f) of the XRD-CT data is the corresponding Compton image, whilst image F in the PDF-CT is the colour coded composite image determined from components A-E coloured accordingly: yellow (KaptonTM), green (basalt), red (glass), pink (polystyrene) and PMMA (cyan). The line graphs, right, show portions of XRD (top) and PDF’s (bottom) for the individual components coloured in accordance with the composite image. |
Initial studies focused on the determination of the composition of a mixture of amorphous and semi-crystalline materials. The images of the distributions of each component are shown in Figure 124. The distributions found by PDF-CT are shown (a-e) with the Compton scatter image shown in (f). Representative XRD and PDF patterns from a voxel containing each component are also shown in the figure for comparison. The PDF-CT images were obtained by fitting a linear combination of the PDFs of each component in each voxel and then plotting the fraction of each phase. The resulting images give a clean separation of the different species present with virtually no misassignment. In many cases the nature of the shortest chemical bond is sufficient to distinguish between the components rendering the technique capable of providing chemical bond or species contrast tomography irrespective of kinetic state.
 |
|
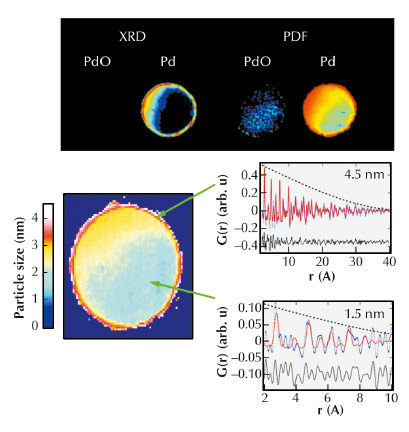
Fig. 125: (Top) Comparison of information from XRD-CT (left) and PDF-CT (right) after sample reduction. (Bottom) Distribution of particle sizes of fcc Pd within the catalyst body under reducing conditions. (Bottom Right) portions of the PDF data for selected pixels at the edge and interior of the catalyst body. |
The second study focused on catalyst bodies which comprise mm-sized porous support units (typically cylinders/spheres) loaded with metals/metal oxides and used in large-scale industrial catalysis. In this demonstration study, we chose to study the distribution of Pd species that comprise the active component for both hydrogenation and oxidation reactions. Figure 125 (left) shows the reconstructed distributions of selected atomic scattering pairs pertaining to the same crystalline phases, e.g. the components with peaks at 3.44 and 2.71 Å in the radial distribution functions due to Pd-Pd pairs in PdO and fcc Pd, respectively. In the treated sample, the XRD-CT map in Figure 125 suggests a preferential distribution of both PdO and Pd phases at the sample periphery. In contrast whilst PDF-CT confirms the preferential concentration of the Pd/PdO seen in XRD-CT, ‘diffraction silent’ metallic Pd particles are also present inside the catalyst body. The observation of diffraction silent Pt in the core of the catalyst is verified further by quantitative analysis of representative PDFs from voxels from the periphery and the core shown in Figure 125 (right). The PDF signal from the “diffraction silent” nanoparticles in the centre of the catalyst body dies out very quickly suggesting these nanoparticles must be very small. Using a spherical model as an approximation of the particles present to the calculated PDF, a good fit for a nanoparticle diameter of ~ 1.4 nm was obtained. In contrast, the particles located at the sample periphery exceed ~ 4 nm.
This new technique is likely to have a significant impact in a wide range of research disciplines from materials science, biomaterials, geology, environmental science, palaeontology and cultural heritage to health.
Principal publication and authors
S.D.M. Jacques (a, b), M. di Michiel (c), S.A. J. Kimber (c), X. Yang (d), R.J. Cernik (a), A.M. Beale (b, e, f) and S.J.L. Billinge (d,g), Nat. Commun. 4, 2536 (2013).
(a) School of Materials, University of Manchester (UK)
(b) Research Complex at Harwell, Rutherford Appleton Laboratory, Didcot (UK)
(c) ESRF
(d) Materials Science and Engineering, Columbia University, New York (USA)
(e) Department of Chemistry, University College London (UK)
(f) Inorganic Chemistry and Catalysis, Debye Institute for Nanomaterials Science, Utrecht University (The Netherlands)
(g) Condensed Matter Physics and Materials Science Department, Brookhaven National Laboratory, Upton (USA)
References
[1] A.M. Beale, J. Ruiz-Martinez and B.M. Weckhuysen, In situ characterisation of heterogeneous catalysts, Eds. J.A. Rodriguez, J.C. Hanson, P.J. Chupas and J. Wiley & Sons, Chichester (2013).
[2] P. Bleuet, E. Welcomme, E. Dooryhee, J. Susini, J.L. Hodeau and P. Walter, Nat. Mater. 7, 468 (2008).
[3] S.D.M. Jacques, M. di Michiel, A.M. Beale, T. Sochi, M.G. O’Brien, L. Espinosa-Alonso, B.M. Weckhuysen and Paul Barnes, Angew. Chem. Int. Ed. 50, 10148, (2011).
partners


European Synchrotron Radiation Facility - 71, avenue des Martyrs, CS 40220, 38043 Grenoble Cedex 9, France.