- Home
- Users & Science
- Scientific Documentation
- ESRF Highlights
- ESRF Highlights 2013
- Enabling technologies
- X-ray phase contrast imaging with nanoradian angular resolution
X-ray phase contrast imaging with nanoradian angular resolution
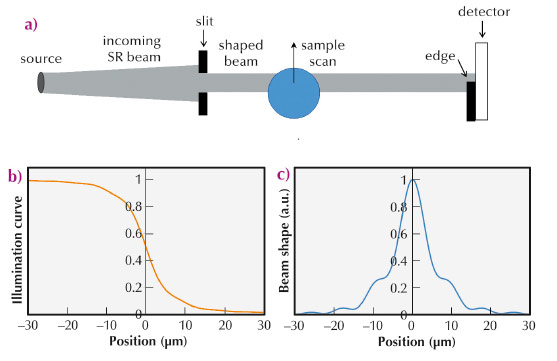
Edge-illumination (EI) X-ray phase contrast imaging (XPCI) was developed in the late nineties at Elettra [1]. The goal was to devise an alternative to analyser-based imaging (ABI, [2]) that would not require the use of a crystal analyser. The idea underpinning this method is that illuminating only the physical edge of the detector pixels enables a fine angular selection on photon direction (Figure 139a), analogous to that obtained through the crystal reflectivity curve in ABI. This analogy, already observed in the original EI paper [1], was later formally demonstrated [3].
 |
|
Fig. 139: Experimental set up (a), “integral” sensitivity curve (b), and derivative of the same, yielding the beam shape (c). |
Eliminating the crystal means that the radiation does not need to be monochromatic or tightly collimated. This enabled the method to be adapted to polychromatic and divergent beams generated by conventional X-ray sources through a pair of apertured masks [4], which repeat the EI configuration over the entire area of a 2D detector. The plurality of beams simultaneously “edge-illuminating” many detector lines replaces the sample scanning used at synchrotrons. Although this setup might superficially resemble that of Talbot interferometry [2], the underlying physical principle is very different. In EI, the aperture pitch is between one and two orders of magnitude larger, and as said its only aim is to repeat the EI condition for each pixel row of a 2D detector. The beamlets are physically separated and do not interfere: the phase sensitivity is created by each beamlet impinging on an absorbing edge. Indeed, the lab implementation of EI is a completely incoherent method: source sizes of up to 100 µm have been used, which lead to a coherence length at least two orders of magnitude smaller than the mask pitch.
Despite this negligible degree of spatial coherence, EI enables quantitative phase retrieval [5]. The spatial incoherence is modelled as a “spread” of each beamlet; however, as long as the edge cuts the “spread” beamlet in half, minimal refraction-induced movements of the beamlet can still be detected, and related back to the phase shift gradient that caused them.
 |
|
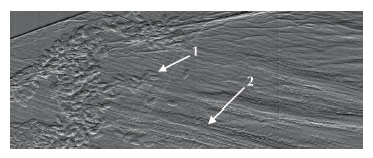
Fig. 140: Differential phase image of a flower petal, with arrows indicating: 1 pollen grains; 2 individual cells aligned in the petal veins. |
The EI method provides intense phase signals with incoherent sources. We wanted to discover whether use of a coherent source could be of benefit. In this work, we found that EI sets a new record for phase sensitivity, as it reduces the detectability threshold for refraction angles by about one order of magnitude compared to previous methods. EI XPCI setups were installed both at ESRF ID17 and on the “coherence branch” of Diamond I13. In both cases, a long sample-to-detector distance (5-15 m) was used to maximise angular sensitivity. We deliberately spanned a wide energy range (12 to 85 keV) to demonstrate the concept’s validity under varying experimental conditions. The data analysis required the development of a new phase retrieval method. In EI, scanning the edge over the detector yields an “integral” sensitivity curve (Figure 139b), which plays the same role as the rocking curve in ABI [3]. Its derivative is equal to the beam shape: with incoherent radiation, this is a bell-shaped curve, normally well approximated by a Gaussian. In the coherent case, diffraction effects make this curve significantly irregular (Figure 139c), and it proved necessary to take these irregularities into account to perform an accurate phase retrieval. Sensitivity curves were simulated by means of Fresnel-Kirchhoff diffraction integrals and successfully compared to the experimental ones, which provided the basis for the modified phase-retrieval method. This was then applied to samples of known optical properties, demonstrating retrieval of the correct refractive indices, i.e. quantitative reliability. Error analysis on the retrieved refraction angle maps enabled determination of the sensitivity threshold, which was ~2 nrad for the data acquired at the ESRF. Finally, to further demonstrate the extremely high angular resolution, we imaged very weakly refracting samples (e.g. a 10 μm thick polypropylene foil in water, which has an almost identical refractive index) and still obtained strong phase signals. The level of angular resolution achieved enables the detection of density gradients of the order of 10–4 g/cm3 mm–1, or thickness gradients of micrometres over millimetres. As an example, Figure 140 shows an image of a flower petal where pollen grains and rows of cells in the petal veins can be clearly distinguished. This new technique is expected to allow previously inaccessible scientific applications to be tackled.
Principal publication and authors
P.C. Diemoz (a,b), M. Endrizzi (a), C.E. Zapata (a,b), Z.D. Peic´ (c), C. Rau (c), A. Bravin (d), I.K. Robinson (b,e) and A. Olivo (a,b), PRL 110, 138105 (2013).
(a) Department of Medical Physics and Bioengineering, UCL, London (UK)
(b) Research Complex at Harwell, Didcot (UK)
(c) Diamond Light Source, Didcot (UK)
(d) ESRF
(e) London Centre for Nanotechnology, London (UK)
References
[1] A. Olivo et al, Med. Phys. 28, 1610-19 (2001).
[2] A. Bravin, P. Coan and P. Suortti, Phys. Med. Biol. 58, R1-R35 (2013).
[3] P.R.T. Munro, C.K. Hagen, M. Szafraniec and A. Olivo, Opt. Exp. 21, 11187-201 (2013).
[4] A. Olivo and R. Speller, Appl. Phys. Lett. 91, 074106 (2007).
[5] P.R.T. Munro, K. Ignatyev, R.D. Speller and A. Olivo, PNAS 109, 13922-27 (2012).
partners


European Synchrotron Radiation Facility - 71, avenue des Martyrs, CS 40220, 38043 Grenoble Cedex 9, France.