- Home
- Users & Science
- Scientific Documentation
- ESRF Highlights
- ESRF Highlights 2013
- Dynamics and extreme conditions
- Microscopic structure of water under conditions of the Earth’s crust and mantle
Microscopic structure of water under conditions of the Earth’s crust and mantle
The detailed structure of liquid water on a molecular scale remains a mystery even after more than a century of research [1]. The explanation for the unusual structure and dynamics of water is still under debate. For example, there is an intense discussion about whether the microscopic structure of water in the liquid phase can be described by a continuum model or a mixture of two components, one with a highly polymerised (fully hydrogen-bonded) network, i.e. closely related to the structure of low-density amorphous ice, and one closely related to high density amorphous ice.
Detailed knowledge of the microscopic topology of water at high temperatures and pressures is also valuable, e.g. for the geosciences. This knowledge might help to better understand the geochemical processes in the crust and upper mantle. Supercritical water is thought to play an important role in heat and mass transfer as well as element fractionation processes in the Earth’s lithosphere. Many geochemical processes and reactions, e.g. the formation of hydrothermal ore and petroleum deposits and even contributions to the origin of life, have been linked to the unique properties of supercritical water [2]. Apart from this fundamental interest in the atomic structure of water under different pressure and temperature conditions, supercritical water is also interesting for many chemical processes where it is used as an inexpensive reaction medium for chemical and material synthesis, waste destruction, plastics recycling, and biomass processing.
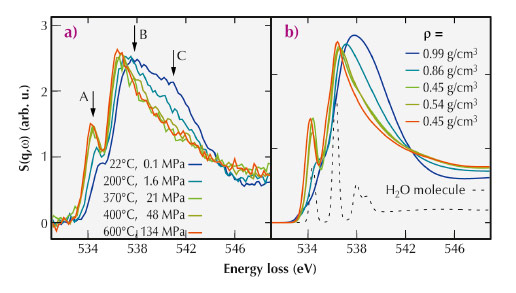
For the present study, we used X-ray Raman scattering (XRS) at the inelastic X-ray scattering beamline ID16 to probe the oxygen K-edge of water contained in a hydrothermal diamond anvil cell (HDAC). With this setup, we were able to produce simultaneously high pressure and high temperature conditions. Using the hard X-rays from ID16 and the XRS technique, we were able to measure the oxygen K-edge, which lies in the soft X-ray regime at ca. 535 eV, from within the HDAC. The measured data is shown in Figure 31a and exhibits a continuous evolution from a water-like spectrum at room temperature and atmospheric pressure to a more gas-like spectrum at the highest temperatures and pressures investigated.
 |
|
Fig. 31: a) Spectra of the oxygen K-edge of water measured at different temperatures and pressures along the liquid-gas coexistence curve. The pre-, main-, and post-edge are indicated by A, B, and C, respectively. b) Calculated spectra for similar temperatures and densities as in (a), as well as a spectrum of a water monomer. The experimental densities are indicated in the figure, and the colour code corresponds to the colour of the respective spectrum also in part (a) of the figure. |
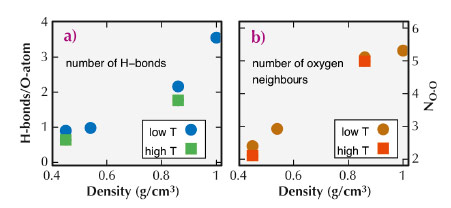
We compared the experimental spectra to those computed using density functional theory and structural snapshots obtained from ab initio molecular dynamics (MD) simulations. The results of these simulations are shown in Figure 31b. Because we find good match between the simulated and measured spectra, we could investigate the atomic structures of the MD simulations to learn more about the details of the molecular arrangements in water. Specifically, we studied the evolution of hydrogen bonds and number of nearest neighbours as a function of temperature and pressure. These results are presented in Figure 32.
 |
|
Fig. 32: Number of H-bonds per H2O molecule (a) and number of nearest neighbours (b) as a function of density extracted from the MD simulation snapshots. The terms “high T” and “low T” refer to values determined for p/T points at equal density but different temperature. |
A detailed analysis of the MD simulation snapshots suggests that at ambient conditions, molecules with four H-bonds and five oxygen neighbours within a distance of 3.6 Å dominate. With temperature and pressure increasing along the vapour pressure curve, the number of H-bonds per molecule decreases to 0.6 at T = 600°C and P = 134 MPa, implying a dramatic increase of distortions of the hydrogen-bond network. For all measured state points, we were able to identify typical local structural environments with specific spectral fingerprints, which describe water at different pressure/temperature conditions. A spatial statistical analysis of the MD simulation boxes suggests that the structure of water at the probed high temperature and pressure conditions can be understood in terms of a homogeneous microscopic structure.
Our experimental findings provide an unprecedented benchmark for new theoretical models, both in terms of simulations of the atomic structures and the calculation of XRS spectra from the models.
Principal publication and authors
C.J. Sahle (a,b), C. Sternemann (a), C. Schmidt (c), S. Lehtola (b), S. Jahn (c), L. Simonelli (d), S. Huotari (b), M. Hakala (b), T. Pylkkänen (b), A. Nyrow (a), K. Mende (a), M. Tolan (a), K. Hämäläinen (b) and M. Wilke (c), Proc. Natl. Acad. Sci. USA 110, 6301 (2013).
(a) Fakultät Physik/Dortmund Electron Accelerator, Technische Universität Dortmund (Germany)
(b) Department of Physics, University of Helsinki (Finland)
(c) Section 3.3, Deutsches GeoForschungsZentrum GFZ, Potsdam (Germany)
(d) ESRF
References
[1] P. Ball, Nature 452, 291–292 (2008).
[2] N. Akiya and P.E. Savage, Chem. Rev. 102, 2725–2750 (2002).
partners


European Synchrotron Radiation Facility - 71, avenue des Martyrs, CS 40220, 38043 Grenoble Cedex 9, France.