- Home
- Users & Science
- Find a beamline
- X-ray nanoprobe
- ID01 - Microdiffraction imaging
- Science on ID01
- Full Field Diffraction X-ray Microscopy
Full Field Diffraction X-ray Microscopy
General Description
The Full Field Diffraction X-ray Microscope (FFDXM) endstation is now open for user experiments [1] !
The concept of FFDXM can be simply understood as the x-ray counterpart of dark-field Transmission Electron Microscopy (dfTEM). X-ray beams of a given scattering angle, coming from a large sample area, are collected for imaging. Compared to dfTEM or to Transmission X-ray Microscopy (TXM), which have both been around for a while, FFDXM is a novel technique with the following advantages :
- There is no strict requirement on the thickness of the samples.
- The penetration depth can be very small (i.e., surface sensitive for surface science) for certain Bragg reflections.
- It uses diffraction contrast rather than absorption or phase contrast, allowing it to automatically filter out scattering signals from different structures.
- The possibility to map out lattice strain and grain orientation distributions in the sample at 100nm spatial resolution.
The same type of measurement could in principle be performed with a better spatial resolution using a Scanning Diffraction X-ray Nanoprobe (also available on ID01), but the real forte of FFDXM lies in its large Field of View (FoV) and short acquisition time, which makes it ideal for in situ and operando experiments.
Characteristics
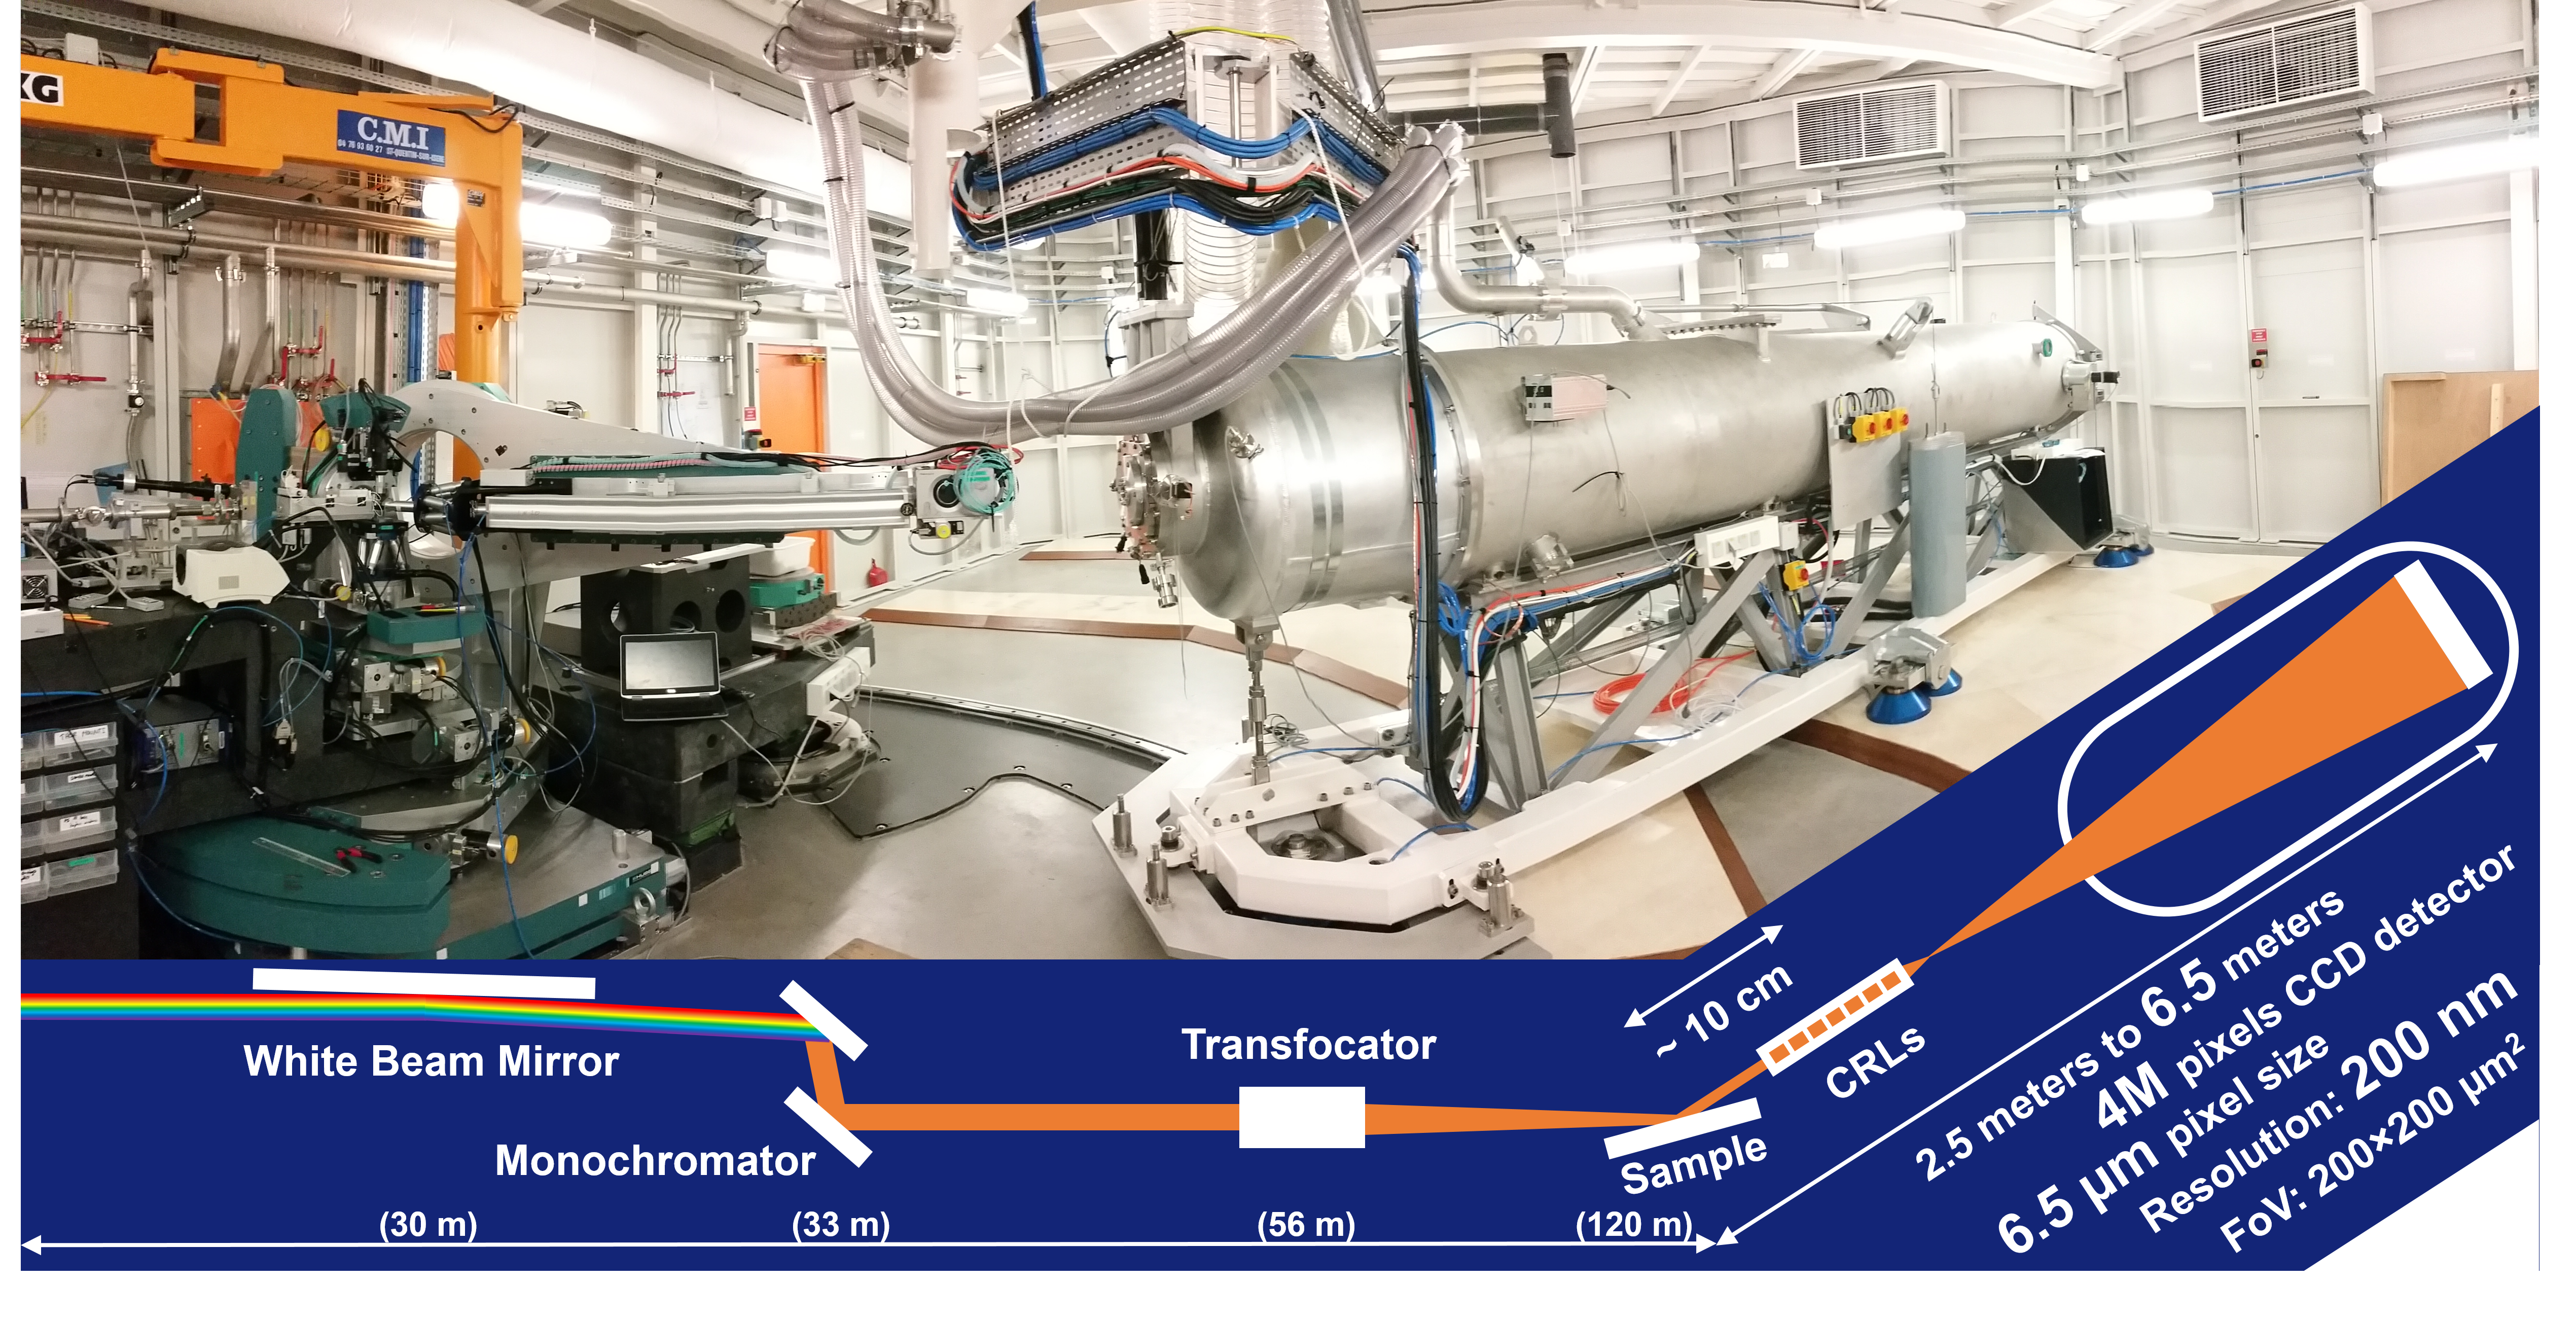
Imaging Optics: (A) Be 2D CRL 50 lens with 50 um apex radius of curvature. (B) 5 sets of SU-8 CRLs from KIT (courtesy of F. Marschall [2]) each have 80-100 lens with constant or varying apertures. The SU-8 lens have a cleaner flat field but are optimized for 17.4keV. For energies below 15keV or above 25keV, the Be lenses should be used which introduces a slightly noisier SAXS background. We also plan to test Fresnel zoneplates and Wolter mirrors in the future.
Condenser: Be transfocators are available as the condenser optics (optional).
Detector: Andor Zyla 5.5 sCMOS detector with 5M (2560×2160) pixels behind 15 um of Gadox scintillator. The pixel size is 6.5um×6.5um. The dynamic range is 25000:1, with the possibility of working under accumulation mode.
Magnification, Spatial Resolution: The focus distance is around 10 cm for the Be lens at 8keV and for the SU-8 lens at 17keV. This leaves a few cm of working distance. The maximum sample detector distance is 6.5m, this gives a magnification ratio of about 65:1. The effective pixel size is thus 100nm. The actual spatial resolution is around 200nm and is limited by the imaging optics.
Aperture, Field of View: The effective aperture size (after absorption correction) is 100um×100um for the SU-8 lens (17keV) and around 230um×230um for the Be lens (8keV). For the SU-8 lens, the FoV is limited by the aperture size but can otherwise be as large as 200um×200um if the entire Andor detector is illuminated.
Angular and Reciprocal Space Resolution: Considering a sample-lens distance of 10cm and an aperture size of 100um, the resulting numerical aperture is NA = 0.0005. The corresponding angular resolution is roughly 0.0573°. The resolution in reciprocal space depends on the scattering angle and on the momentum transfer value, but should be in the range of 0.001 to 0.005Å-1. A typical value for strain resolution in this case is 5×10⁻⁴ thus comparable to standard XRD measurements at synchrotrons.
Acquisition Time: The standard acquisition time is 1s per frame, but may need to be increased to 10s depending on the scattering power of the sample. There is currently an overhead of 4s and we are working hard to reduce that.
Examples
ESRF logo (Proof of Concept)
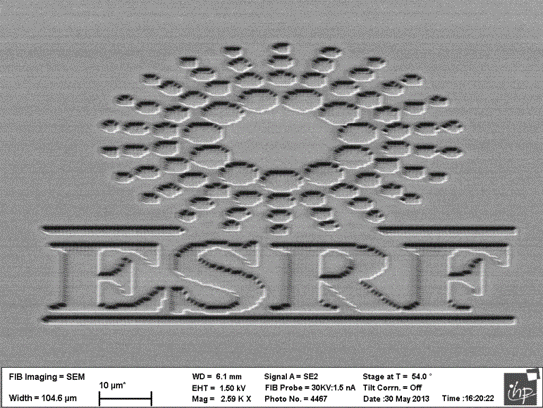
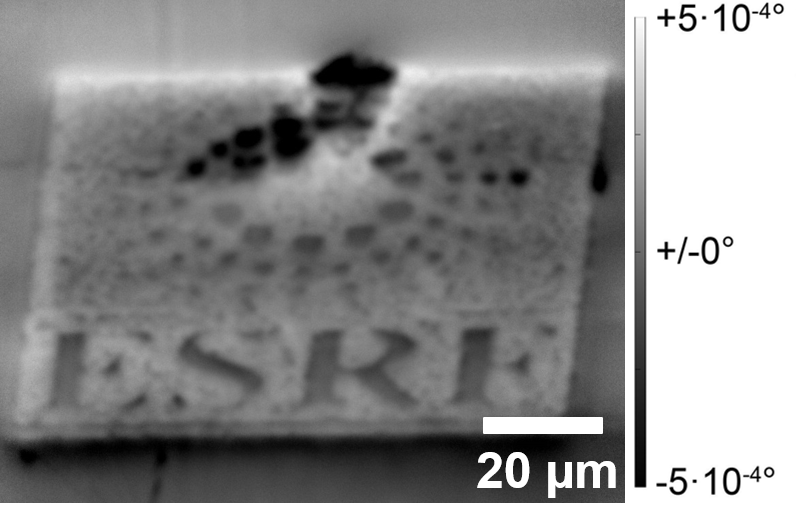
Fig. 1: (left) SEM image of an ESRF logo etched by FIB on a Si0.8Ge0.2 thin film and (right) the corresponding FFDXM image. The contrast in the latter is the angular deviation of the rocking curve peak center from their theoretical bulk position.
As a proof of concept, an ESRF logo was etched by Focused Ion Beam (FIB) onto a 40 nm Si0.8Ge0.2 thin film. The exposure to the ion beam induced a misorientation in the lattice, which is then visible as diffraction contrast on the FFDXM image.
Fig. 2: (right) FFDXM image taken at different angles of incidence. The incident angle and the integrated intensity over the whole detector is shown on the (left).
On the two sides of the peak of the rocking curve the contrast in certain areas was inverted and indicates opposite lattice tilt between these areas. The exposure time in this case was 1s. The maximum photon count of a pixel was 4700.
Implanted Si wafer (in situ annealing)
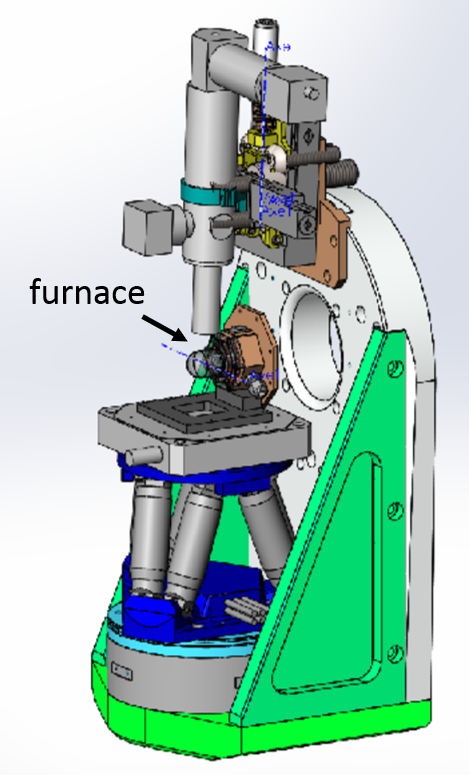
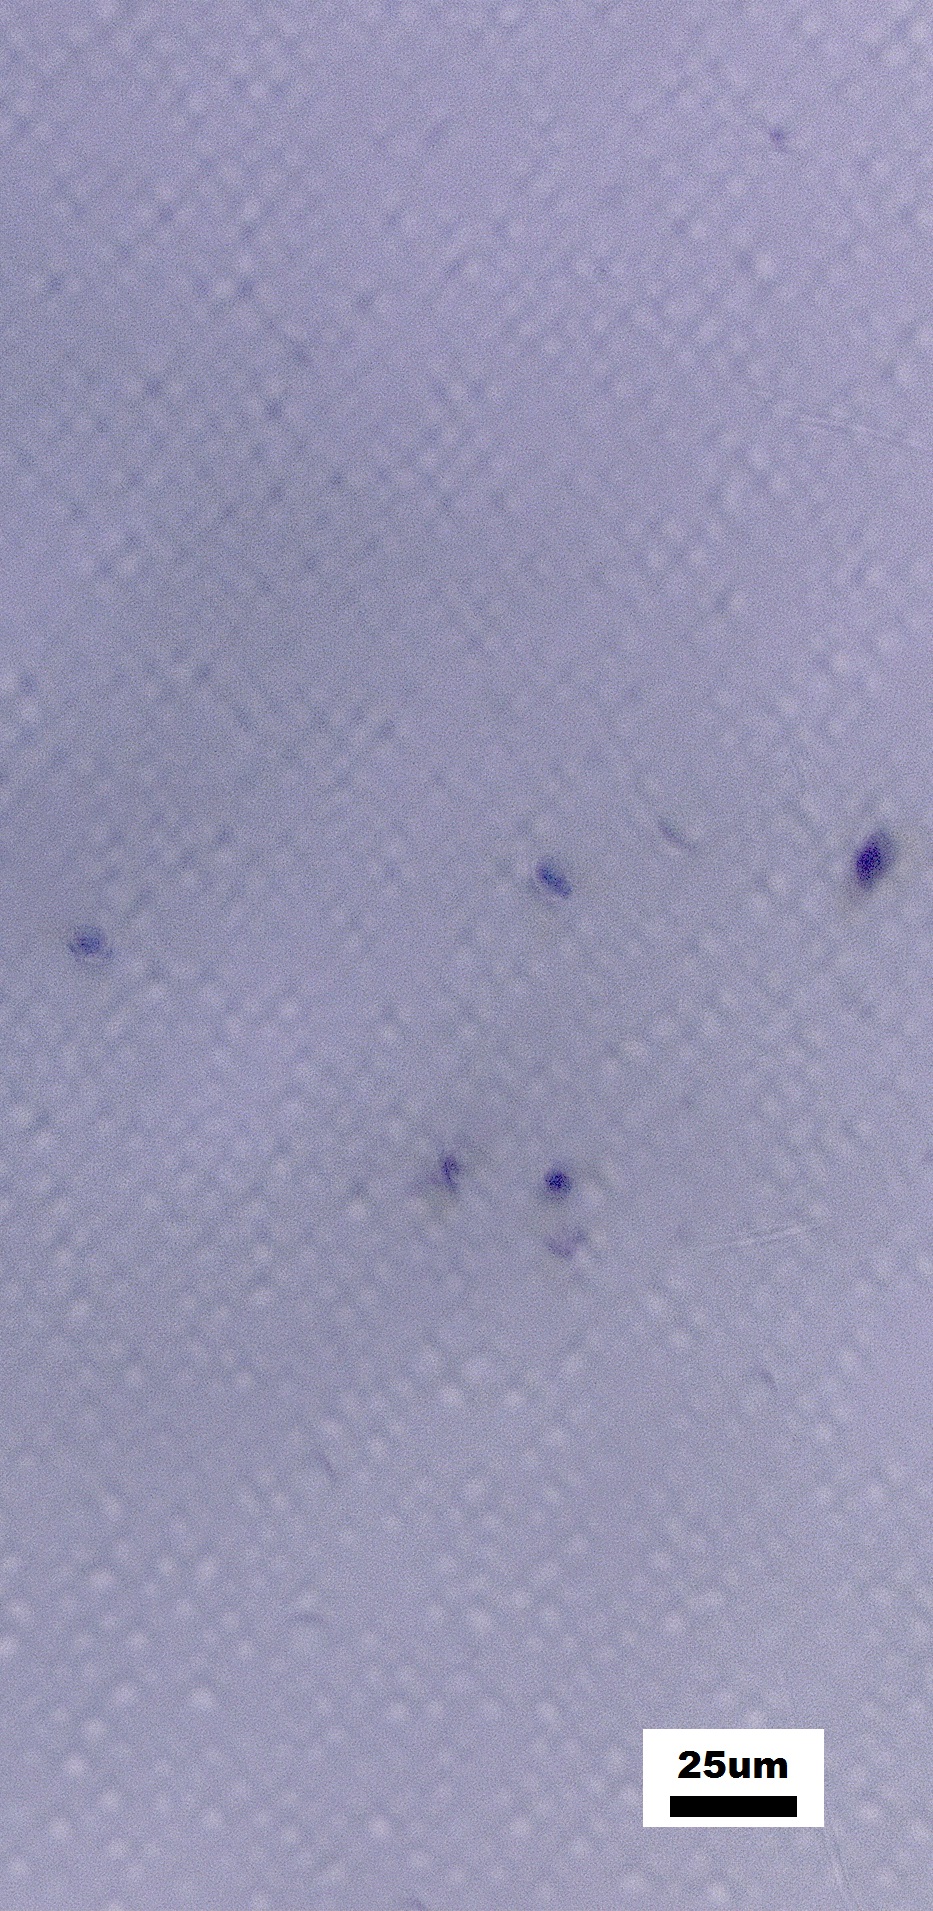
Fig. 3: (left) Schematic of the setup. The sample was mounted vertically on a button heater inside a Be dome under primary vacuum. The heater can reach 1100°C theoretically and was tested up to 700°C experimentally. (mid) The waviness at the surface was visible under optical microscope. (right) Series of FFDXM images acquired at off-Bragg angle (+0.007°) during in situ heating from 400°C to 450°C.
Earlier in July 2018 we had the chance to perform our very first in situ experiment. The subject of study was a Si(001) sample (courtesy of S. Tardif, CEA/INAC) with H2 implantation. The deformation induced by the pressurized H2 bubbles was visible even under an optical microscope. The deformation was also observed by FFDXM at off-Bragg angles. While most bubbles (red circles) were stable, some of them (black circles) were seen to move during the annealing process (to be verified!).
The analysis of this data is still in progress. Ongoing development includes better particle (bubble) tracking routines and image corrections. The exposure time in this experiment was 1s. The maximum photon count was 3000 on the above images and exceeds 60000 at the Bragg condition.
Li-Si battery cell (in operando electro-chemistry)
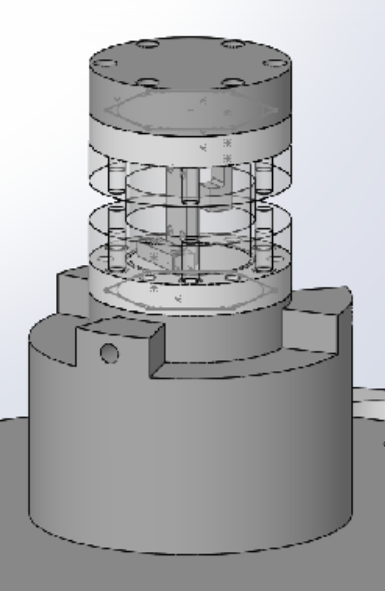
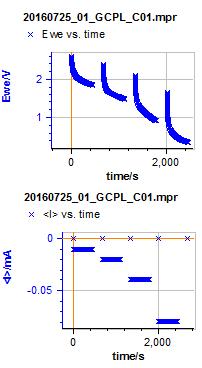
Fig. 4: (left) Schematic of the Li-Si battery cell v 1.0. The two electrodes were mounted vertically as required by our experimental setup. (mid) Graphs showing one of the GCPL cycles. (right) Series of FFDXM images acquired at off-Bragg angle (-0.012°) during the charging-discharging cycles.
In mid July 2018, another in operando experiment was commissioned, this time with our homemade Li-Si battery cell. The charging and discharging cycles were carried out with a BioLogic SP-240 potentiostat (courtesy of J. Drnec). Strong lithiation was observed after driving more than 10mA from the battery. Angular shift of the Bragg peaks (from their bulk position) of as far as ±0.08° was recorded during the rocking scan.
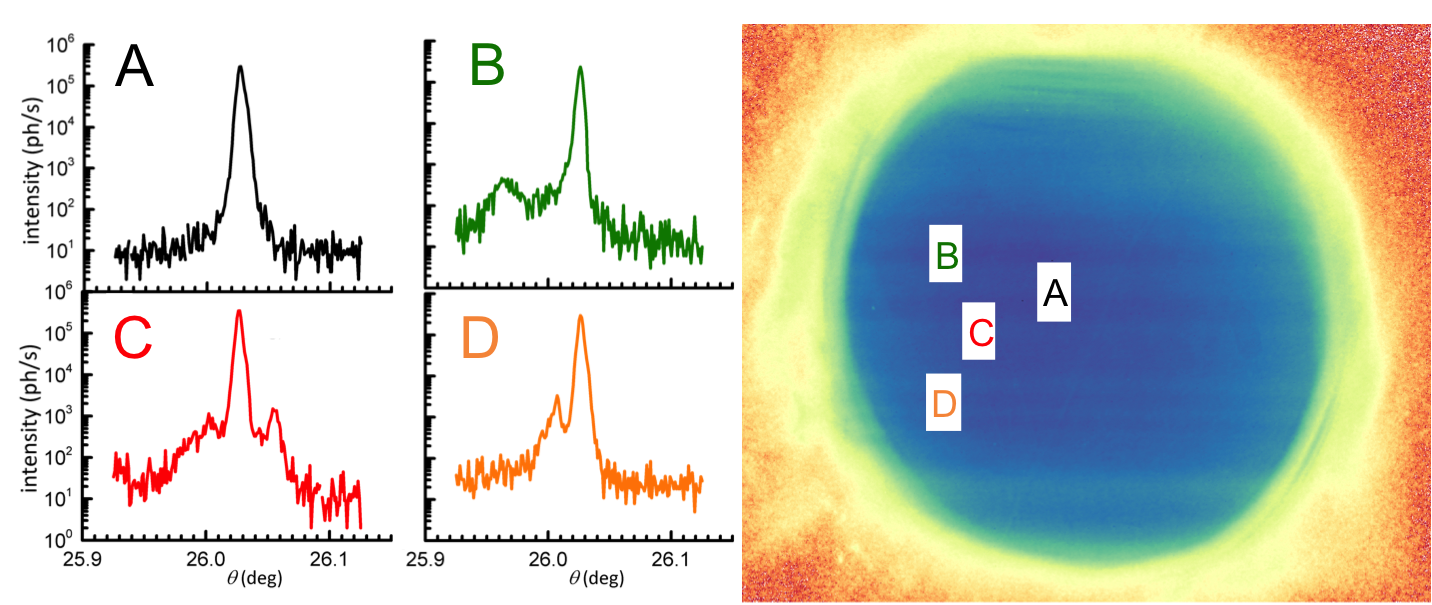
Fig. 5: (left) Rocking curves on different part of the sample extracted from one single scan. Their position on the sample is marked on the figure on the (right).
Thanks to the large FoV, rocking curves of different parts of the sample can be measured with one single scan. A strong inhomogeneity was observed. The exposure time in this experiment was 1s. The maximum photon count was 1500 on the above images and exceeds 60000 under Bragg condition.
Sample Requirements
As the big pipe that hosts the detector only moves in the horizontal plane, the sample needs to be mounted vertically to achieve the highest spatial resolution under reflection geometry. There is no further requirement on the sample thickness and the experiment can even be surface sensitive (1/e length ~ 10nm) for certain Bragg reflections. Only the volume down to the penetration depth will be probed in this case.
When diffracting under transmission geometry, the sample thickness has to be limited. The technique is illustrated elsewhere [3]. The entire sample will be probed similar to the case of X-ray tomography, but with an additional sensitivity to lattice strain, grain orientation and with a much better spatial resolution.
Single crystals are the best samples. Polycrystals will also work, preferably with grain size larger than the 200nm (the spatial resolution). No test has yet been done on powder samples but it may work depending on what (kind of signal) one is after.
For single crystal samples, there should ideally be some inhomogeneity within the FoV, so that one can really observe how different parts of the sample react during the process. (otherwise there is no need for full field imaging.)
In situ or operando experiments are recommended as they can help to realise the full potential of the instrument.
Contact
Dr. Tobias Schulli tobias.schulli@esrf.fr (+33) 04 76 88 22 80
Dr. Tao Zhou tzhou@anl.gov
References
[1] Hilhorst, J. et al. Full-field X-ray diffraction microscopy using polymeric compound refractive lenses. J. Appl. Cryst. (2014).
[2] Marschall, F. et al., Simulation of aperture-optimised refractive lenses for hard X-ray full field microscopy. Optics Express (2016)
[3] Simons, H. et al. Dark-field X-ray microscopy for multiscale structural characterization. Nat. Commun. (2015).
partners


European Synchrotron Radiation Facility - 71, avenue des Martyrs, CS 40220, 38043 Grenoble Cedex 9, France.