- Home
- Users & Science
- Find a beamline
- Collaborating research group beamlines
- BM 14 & BM26 - DUBBLE - Dual Belgian Beamlines
- BM26: SAXS/WAXS
- Sample Environment
- overview non-standard sample environment
- Microstructural understanding of plastic films blown in-situ on BM26B
Microstructural understanding of plastic films blown in-situ on BM26B
Structure Evolution During Film Blowing: An Experimental Study Using In-situ Small Angle X-Ray Scattering
BM26B data allow the nano-scale microstructural features of the polymer film to be correlated with industrial film-blowing conditions as described in a recently published article in the European Polymer Journal doi:10.1016/j.eurpolymj.2015.11.022.
One of the wonders of the modern world must be plastic film - in the form of sheets or the ubitiquitous plastic bag. A myriad of subtly different properties (strong, weak, clear, opaque, good barrier properties or semi-permeable) for a multitude of purposes from shopping to food protection, via crop shelters and pharmaceutical packaging. As is so often the case, the seemingly simple is anything but.
Most polymer films are manufactured by film blowing (blown film extrusion) which, though simple, rapid and cost effective, leads to complex morphologies and final plastic properties that are strongly dependent on processing conditions (as well as on the polymer composition).
The process of film-blowing
The process starts with solid chips of polymer which are fed into a single screw extruder which melts the polymer and pumps it into a die, as shown in Figure 1.
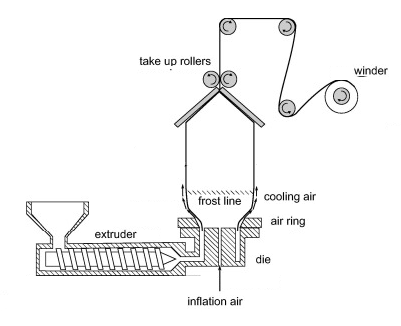
Air is blown up into the centre of the extruded tube which causes it to expand in the radial direction, blowing it up like a balloon. The melted polymer is then cooled rapidly by air blown externally around the ring.
Extension of the melt in both the radial and vertical directions stops at the frost line (or freeze line) where the polymer melt solidifies, although crystallisation continues for some distance beyond.
Rollers at the top form an air seal so that a constant pressure, just above atmospheric, is maintained inside the bubble. The inflated, solidified tubular bubble is then flattened as it passes through the take-up rollers, which also provide the axial tension needed to pull the film upward. Finally the film can be rolled up as the flattened tube for use as bags, or cut longitudinally into two sheets.
The microstructural complexity arises because the solidifying polymer melt undergoes strong biaxial stresses and steep thermal gradients, which lead to partial polymer orientation and complicated non-equilibrium morphologies as dictated by the processing conditions. Macroscopic mechanical and optical properties, including haze and clarity, are strongly dependent on the nano-scale morphological features created, such as lamellar thicknesses and crystalline superstructures. Empirical know-how and trial and error are used to modify the processing variables and the material composition to tune the final properties of the film, but this is clearly expensive and time consuming and the optimum conditions may not always be found. Consequently numerical models are being developed so that processing conditions can be modified a priori to obtain the desired properties. The real-time microstructural data of films under processing conditions collected on BM26B by the authors of this study are required to improve and validate these numerical models.
Experimental setup on BM26B
A Collin Blown Film Unit type 180-400 and extruder were installed in the large experiments hutch of BM26B. A picture of this impressive setup is shown in Figure 2.
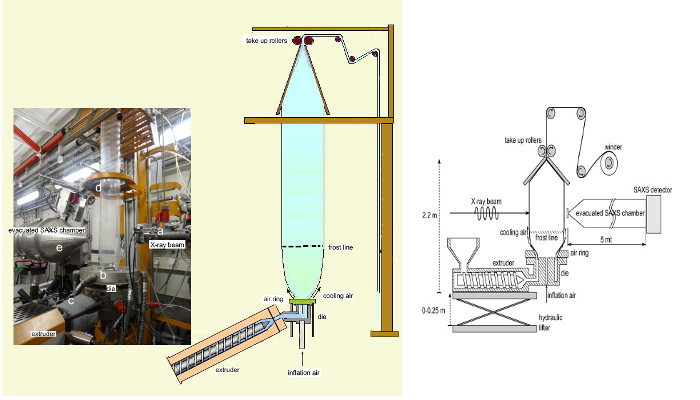
The film blowing line is relatively small compared most blown film in industry, around 2.2m high, but sufficient to allow SAXS measurement of the polymer during the film blowing process. The extruder was mounted on a hydraulic table allowing the die to be lifted vertically 0.25m thus permitting X-ray measurements both above and below the polymer frost line. A video camera to monitor bubble size and shape is visible above the SAXS chamber. The die extrusion temperature was set at 190°C.
Measurement of strain in the polymer film
The aim is to correlate the polymer microstructure measured by the SAXS to the processing conditions. The key industrial processing parameters are the strain rates in the vertical (machine) direction, governed by the “take-up ratio” (TUR), and the stretch in the transverse direction governed by the expansion of the bubble, the “blow-up ratio” (BUR). However, the authors went further than simply using the processing TUR and BUR parameters. They estimated the local strain rates in both the vertical (machine) and the transverse (horizontal) directions by fitting both the vertical velocity profile and the bubble radius as a function of the distance from the die exit.
The bubble shape was derived by image analysis of the video frames to give a description of the variation of the bubble radius as a function of vertical distance from the die. These results were then used to calculate the strains and the strain rates along the machine and transverse directions.
They find that the strain in both machine and transverse directions increases gradually until reaching a plateau value after the frost line when both velocity and radius of the bubble become constant (indeed it is the absence of further stretching that defines the frost point). At high take-up ratios (TUR), the strain rates in machine direction are higher than in transverse direction by a factor between 2.5 and 4. At low take-up ratios, stresses and hence strain rates in the transverse direction become higher. The relative ratio between the two decreases for the experiments conducted at high blow-up ratio (BUR), where the strain rates in the two directions are comparable.
Microstructure derived from SAXS patterns
The nano-scale structure evolution at different heights could be examined by raising the die and extruder step by step using the hydraulic lifter. The 2D SAXS scattering patterns were recorded at different heights, ranging from close to the die exit to 5 to 10cm above the solidification frost line. The authors compared results for three different industrially relevant polymer compositions: two commercial linear low density polyethylenes (named LLDPE 1 and LLDPE 2 in this work) and a blend of LLDPE 2 with 10%wt of low density polyethylene (LDPE). They have beautifully detailed results which clearly show the substantial structural changes above the frost line, i.e. after solidification. The raw SAXS patterns are illustrated in Figure 3 which includes one representative pattern below, and one above the frost line for each sample and set of film-blowing conditions.

Qualitative interpretation
The LLDPE 1  data all show polarised, anisotropic, 2D scattering patterns. Below (close to) the frost line these can be interpreted to mean that lamellae with a long correlation length start to form with their normals parallel to the machine direction. Above the frost line at high BUR the two distinct lobes indicate the formation of regularly spaced stacks of lamellae oriented with their normals parallel to the machine direction (Figure 4e). Above the frost line at low BUR, the tear drop shape indicates that the lamellar morphology (still with normals in the machine direction) has a broader distribution of spacing and thickness than at high BUR (Figure 4d). At low take-up ratios (TUR) at both high and low BUR, the 2d pattern of two lobes superimposed on some isotropic radial scattering is indicative of stacks of oriented lamellae mixed with randomly oriented crystals (Figure 4 a and e).
The second linear low density polyethylene studied, LLDPE 2, exhibits less anisotropic SAXS patterns. The deviation from the vertical direction of the anisotropy is not significant; it reflects a slight experimental misalignment of the film with respect to the machine direction. Similar qualitative descriptions can be made for these data as for the LLDPE 1 sample, but the isotropic scattering patterns indicate a rather low degree of orientation of the lamellae (Figure 4 a and b).
The final set of data show that blending LLDPE 2 with 10%wt of LDPE has a huge effect on the morphology. Below (and close to) the frost line at high TUR the scattering looks like a vertical streak. This corresponds to stacks of lamellae with small lateral size and different thicknesses highly oriented in the machine direction (Figure 4 c). Above the frost line the patterns evolve into tear drop shaped lobes (Figure 4 d): lamellae are well oriented in the machine direction but their spacing varies. At low TUR the addition of the LDPE polymer has caused the LLDPE 2 polymer to adopt a morphology more similar to that of the LLDPE 1 sample (which had lower molecular weight, higher polydispersity and a lower degree of branching). For low TUR and low BUR a rather diffuse scattering pattern is observed at the frost line. At 22 cm away from the die a rather small interference peak appears, indicating the presence of few oriented lamellae with small lateral sizes and a broad distribution of long periods and thicknesses.
Quantitative interpretation of SAXS patterns
A quantitative analysis proceeds by considering data parallel and perpendicular to the long axis of the anisotropic scattering patterns separately. The data are able to determine relative degrees of lamellar orientation as a function of processing conditions, position relative to the frost line and sample composition. They can also be used to find lamellar thickness. WAXS data (not described here) can also be used to determine overall sample crystallinity as a function of position.
1D intensity profiles of the 2D SAXS patterns were obtained by averaging the intensity over a small region centred around the peak in the radial intensity profile (Figure 5)

Corrected data were used to calculate the average values of lamellar thickness (lc) and long period (L) as shown in Figure 6 and described in Troisi et.al. doi:10.1016/j.eurpolymj.2015.11.022.
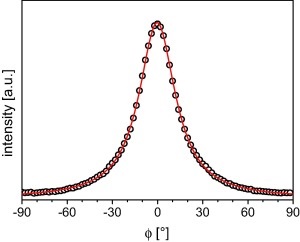
The index of linear crystallinity was then evaluated by the ratio between the lamellar thickness and the long period (lc/L). Scattering intensity data as a function of azimuthal angle ø (defined in Figure 5) were fitted with a Lorentzian function and the reciprocal of the full width at half maximum (1/FWHM) was used as a measure of the degree of orientation. More oriented samples have a narrower azimuthal intensity distribution. An example of these data is given in Figure 7.

Using this analysis the authors were able to use the data to show that the TUR has a major influence on the degree of lamellar orientation. They were able to identify two different cases: for LLDPE 1, LLDPE 2 and for the LLDPE 2 + LDPE blend processed at low TUR, the orientation reached constant values immediately after the frost line, whereas the LLDPE 2 + LDPE blend processed at high TUR showed a decrease of the degree of orientation moving away from the frost line. In the first case, stacks of lamellae formed from the melt orient in machine direction, their orientation being proportional to the stresses applied in machine direction (depending on the take-up ratio). In the latter case the lamellae formed from the melt have a small lateral size. The lateral growth of these lamellae causes the observed decrease in orientation.
The LLDPE 1 sample with narrower polydispersity always showed greater lamellar orientation than the more polydisperse LLDPE 2 sample with higher branching. The blend always showed the highest degree of lamellar orientation and at high TUR this was up to 4 times higher than the neat material.
They were also able to show that the evolution of lamellar thickness along the bubble is governed by the blow-up ratios for all the samples measured. Lower BUR result in thicker films and slower cooling rates, which translate into slightly higher lamellar thicknesses. A decrease in the average lamellar thickness was observed moving up from the frost line. Thinner lamellae, constituted by shorter linear sequences and therefore requiring higher under-coolings to crystallize, insert in between a template of thicker primary lamellae formed close to the frost line. Consequently the average lamellar thickness decreases as progressively thinner lamellae crystallize as a function of distance above the frost line.
Lamellae thicknesses of between 4 - 5.5 nm were found for all the materials and the processing conditions, in agreement with typical values found in literature for LLDPEs at high supercooling. Some differences were observed at high take-up ratios, where the blend always showed the largest thickness lamellae, followed by LLDPE 1 and LLDPE 2. The authors interpret this by higher shear or elongational flow producing row nuclei which promote crystallization kinetics by increasing the nucleation density by orders of magnitude. The undercooling required to crystallize is then lower and the lamellar thickness is higher.
To conclude..
Installation of realistic industrial film-blowing apparatus on the BM26B beamline has allowed on-line study of the film blowing process by small angle X-ray scattering. The data provide detailed nano-scale structural information that can be used to understand and control the film-blowing process. These data help understand how processing conditions lead to the final film properties, and can be used to validate and improve numerical models.
References
https://www.youtube.com/watch?v=HVG1RFzuxwk
E.M. Troisi, M. van Drongelen, H.J.M. Caelers, G. Portale, G.W.M. Peters, “Structure Evolution During Film Blowing: An Experimental Study Using In-situ Small Angle X-Ray Scattering”, European Polymer Journal, (in press) 23 November 2015, ISSN 0014-3057, http://dx.doi.org/10.1016/j.eurpolymj.2015.11.022.
http://polymerprocessing.com/operations/fblow/
Blown film diagram from the British Plastics Federation http://www.bpf.co.uk/plastipedia/processes/Blown_Film.aspx
partners


European Synchrotron Radiation Facility - 71, avenue des Martyrs, CS 40220, 38043 Grenoble Cedex 9, France.