- Home
- Users & Science
- Scientific Documentation
- ESRF Highlights
- ESRF Highlights 2006
- X-ray Absorption and Magnetic Scattering
- Redox and speciation dispersive-XANES micro-mapping: application to a natural sample
Redox and speciation dispersive-XANES micro-mapping: application to a natural sample
We have recently developed a new way to investigate heterogeneous samples that lets us derive quantitative information relating to the oxidation state and/or the speciation of a given element as well as its concentration. The technique takes advantage of the key features of a “dispersive-XAFS” beamline such as ID24 at the ESRF, namely (1) simultaneous collection of a complete spectrum, (2) extremely fast data collection, and (3) high stability of the X-ray beam during data acquisition thanks to the “motionless optics”. Moreover, recent improvements of the optics allow a focal spot of around 5 by 5 µm at the iron K-edge [1].
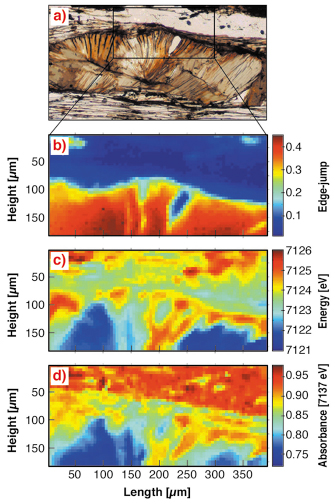
The first XANES measurements were made at the iron K-edge on a thin section of a metamorphic rock from the Sambagawa high-pressure belt (Shikoku Island). The sample was 30 µm in thickness and was positioned on a 1 mm glass holder so that fluorescence detection was possible using the so-called “Turbo-XAFS” setup. The mapped region (390 by 180 µm) included minerals that are highly differentiated in terms of iron contents, examples being chlorite (~ 30 wt.%), phengite (~ 4 wt.%) and quartz (hundreds of ppm). The sampling was performed every 5 µm so that around 3000 XANES spectra were collected in around 100 minutes. At this stage, it was possible to generate maps from the raw data at different energies, which are comparable to the “standard” XANES mapping technique (i.e. a collection of maps at different energies). However, dispersive-mapping provides “full-XANES spectra” collected in a single scan of the sample. Such a “good quality” data set has potential for processing to extract quantitative information. Thus, the most significant part of this work consisted of developing tools to automate a reliable normalisation, and to provide access to information relating to the complete set of data. The program has been developed with Matlab®. Results revealed less than 0.5% of the spectra with aberrant normalisation, exclusively for extremely low iron content regions of the sample. Figure 99 presents qualitative maps obtained after normalisation of the XANES spectra. In particular, edge-jump information was used to visualise the distribution of iron in the sample, and edge-position was used to visualise qualitatively the oxidation state of iron. Another map displays the normalised-absorbance at 7137 eV for the speciation of iron. Results show that iron is mainly located in chlorite (red region), while phengite and quartz are much less concentrated (Figure 99b, blue and dark blue regions, respectively). Also, the oxidation state of iron in chlorite appears highly contrasted. The dark blue corresponds to the more reduced regions whereas the red corresponds to the more oxidised ones (Figure 99c). Moreover, the “speciation” map shows a clear contrast for quartz, and a relatively good correlation with the “redox” distribution in chlorite (Figure 99d).
 |
|
Fig. 99: a) Optical image showing chlorite (middle), quartz (top), and phengite (between chlorite and quartz and at the bottom); b) iron contents (edge-jump); c) iron redox (edge-position); d) iron speciation. |
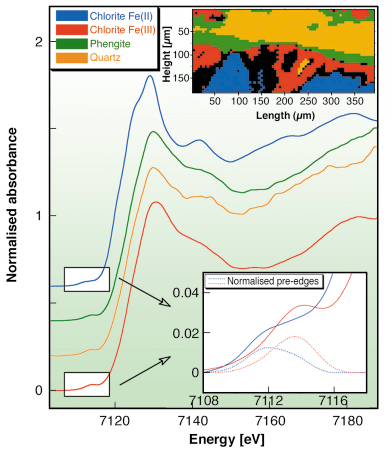
In order to derive quantitative information, we defined masks corresponding to each region highlighted from the different maps. Figure 100 presents the different masks as well as the corresponding XANES (i.e. average of the spectra corresponding to the pixels of the masks). The signal-to-noise ratio is then high enough to analyse pre-edge peaks (see graph inset). Results obtained for the redox contrast in chlorite are in excellent agreement with thermodynamic calculations [2].
 |
|
Fig. 100: Averaged XANES spectra corresponding to the different masks defined from the maps, and an enlargement of pre-edge peaks and their normalisation (dashed lines) for chlorite-Fe(II) and chlorite-Fe(III). |
This new approach of micro-XANES mapping opens new ways for the characterisation of heterogeneous materials in Earth Sciences, including in situ high-pressure and high-temperature “diamond-anvil cell” experiments. Other domains such as Physics, Chemistry or Life Sciences may also find some useful applications.
References
[1] S. Pascarelli, O. Mathon, M. Muñoz, T. Mairs, J. Susini, J. Synchrotron Rad., 13, 351-358 (2006).
[2] O. Vidal, V. De Andrade, E. Lewin, M. Muñoz, T. Parra, S. Pascarelli, J. Metamorphic Geol., 24, 669-683 (2006).
Principal Publications and Authors
M. Muñoz (a, b), V. De Andrade (a), O. Vidal (a), E. Lewin (a), S. Pascarelli (b), J. Susini (b), Geochem. Geophys. Geosyst., 7, Q11020 (2006).
(a) Laboratoire de Géodynamique des Chaînes Alpines, OSUG, Grenoble (France)
(b) ESRF
partners


European Synchrotron Radiation Facility - 71, avenue des Martyrs, CS 40220, 38043 Grenoble Cedex 9, France.