Figure 40
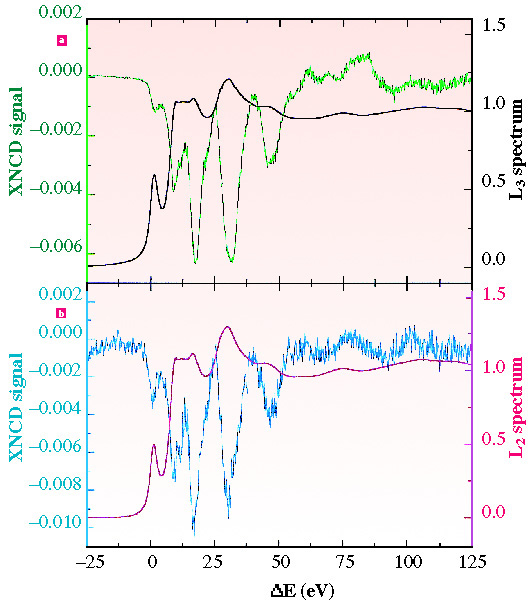
Fig. 40: Normalised XNCD spectral differences [![]() L -
L - ![]() R] at the LIII edge (upper trace) and at the LII edge (lower trace). Relative energy scales were used for convenience. The polarisation averaged XANES spectra are also displayed for the sake of comparison. Note the striking similarity in the morphology of the two XNCD spectra which have both the same negative sign.
R] at the LIII edge (upper trace) and at the LII edge (lower trace). Relative energy scales were used for convenience. The polarisation averaged XANES spectra are also displayed for the sake of comparison. Note the striking similarity in the morphology of the two XNCD spectra which have both the same negative sign.
partners


European Synchrotron Radiation Facility - 71, avenue des Martyrs, CS 40220, 38043 Grenoble Cedex 9, France.