Figure 30
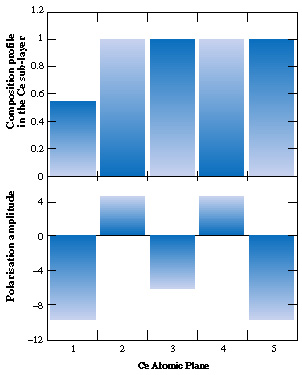
Fig. 30: Polarisation and composition profiles across the Ce sub-layer, resulting from the fitting procedure. Polarisation amplitude is given in units of the average XMCD amplitude.
partners


European Synchrotron Radiation Facility - 71, avenue des Martyrs, CS 40220, 38043 Grenoble Cedex 9, France.