Scientific Examples
ID15A routinely employs a variety of techniques to characterise operating chemical systems. Examples of the different experimental techniques are given below.
Diffraction computed tomography
Recent advances in hardware and software have made X-ray diffraction computed tomography (XRDCT) routinely available for users on ID15A. XRDCT allows tomographic reconstruction of three dimensional objects, where in the reconstructed voxels contain not just scalar information as in conventional absorption or phase contrast tomography, but vector information, in the form of a reconstructed diffraction pattern. This provides unique, non-destructive information inside working systems. Using the beam sizes typically available at ID15A, variable spatial resolutions down to a hundreds of nanometres may now be achieved. Samples up to several mm in diameter may be studied, and, depending on the size and desired spatial resolution, sub minute time resolution can be possible.
X-ray diffraction computed tomography requires that the sample/subject is exposed to X-ray radiation with a series of transmission ‘projection’ measurements being made at over an angular range. A pixelated 2D image slice is then reconstructed from these measurements via a suitable algorithm based on the differences in the scattering signals from the phases present. Several 2D slices are then ‘stitched’ together to create a 3D image, as illustrated below.

Typical applications of XRDCT include catalysis, where supports destined for industrial flow beds are routinely measured, energy systems such as batteries, fuel cells, thermoelectrics, etc., measured during cycling under real conditions, as well as samples of interest in for cultural heritage, geophysics, and life sciences. In the example shown below (Finegan et al., 2020), illustrates the richness of data which can be collected by this method.
In this experiment, sequential 1 µm resolution XRD-CT slices were taken during discharge of a Li vs LixMn2O4 cell, allowing the progression of lithiation of the electrode phase to be followed. The discharge profile is shown as an inset and the blue regions indicate when XRD-CT slices were recorded. A particle that appears to deviate from the bulk is isolated and magnified. Figure B shows histograms composed of the lattice parameter values assigned to each voxel in XRD-CT slices 1–5. The pink region highlights the range of lattice parameter values over which a bi-phasic reaction of LixMn2O4 passes without occupying, i.e., a region that is not characteristic of the spinel LixMn2O4 stoichiometry. Equivalent histograms for the single isolated particle show that the particle’s lattice parameter occupied a range that is not typical for LixMn2O4 as seen in figure c.

Many further recent results can be found in the Publications section.
In-situ diffraction using complementary probes
Due to the poorly crystalline and multiphase nature of many real materials, diffraction alone cannot provide all the information needed to solve problems in e.g. catalysis. Experiments which combine hard x-ray diffraction, reagent flows, spectroscopy, mass spectrometry etc have therefore been developed. All of these factors are typically triggered in a synchronous fashion by SPEC. In perhaps the definitive example of this approach, supported Pd nanoparticles for three way auto catalysts were investigated using XRD, DRIFTS infra red spectroscopy and mass spectrometry performed in parallel:
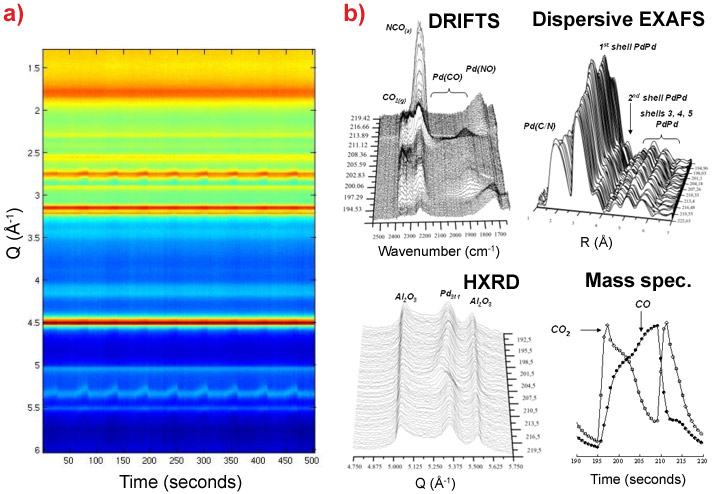
Figure 1. a) Colour map representation of the time dependent powder diffraction of supported Pd nanoparticles during CO/NO cycling at 673 K (10 cycles). b) Data from the four probes –DRIFTS, EXAFS, MS and HXRD ([311] reflection from Pd, straddled by 2 Al2O3 reflections) that may be applied in situ using the new experiment and pertaining to a single NO-CO-NO cycle. Each of the X-ray techniques may be used in conjunction with simultaneous time resolved DRIFTS and MS.
In this work, it was possible to show that the Pd nanoparticles were reversibly taking up carbon during the catalytic cycle. Full details may be found in : M.A. Newton et al, J. Am. Chem. Soc. 132, 4540 (2010).
Ultra-High Time Resolution High Energy Scattering
Until recently, stroboscopic diffraction has been carried out with low energy X-rays, principally due to the characteristics of the detectors used. With time gating capabilities resulting from the development of the Dectris CdTe pixel detector described above, it has become possible to port those experiments to high energy and thus broaden the classes of systems studied.
An example of such an experiment is shown in Figure 14, in which domain switching in a BiFeO3 sample was measured with 10 μs time resolution

Total Scattering
Crystallographic methods like Rietveld analysis require accurately integrating the intensity under Bragg reflections, and ignore any diffuse scattering between peaks. While this works remarkably well in many cases, but only characterizes the average structure of the material, and ignores short and medium range interactions which may have crucial effects on the material properties. Furthermore, badly crystalline and particularly amorphous materials cannot me characterized this way. Thus, as functional materials become more and more disordered, alternative techniques are needed. By exploiting the Fourier relationship between real and reciprocal space, it is possible to generate a real-space histogram of the bond lengths in a material- the so-called pair distribution function (PDF). To avoid termination ripples, it is necessary to measure a wide range of momentum transfers, e.g. 1 < Q < 20-30 Å-1. This technique is thus ideally suited to a high energy beam line like ID15A. Applications now cover a large range of materials from fields as diverse as cultural heritage, materials chemistry, geophysics and biochemistry.
In a recent example (Krayzman et al., 2020), local structural distortions in Titania nanorods were characterised by a combination of total scattering studies and numerical simulations. These structures are of interest as photocatalyts, but exist in a large number of structural polymorphs which modify their properties. The quality of total scattinering data now available made it possible to perform reverse Monte Carlo refinements of the heterogeneous distribution of nanorods comprising the sample, allowing their detailed characterization without the need to imposed symmetry. Remarkably, the uncontrained refinements reproduced the local symmetry predicted by DFT calculations, and allowed the both the variation of lattice parameter with respect to the bulk, as well as within a single particle, to be characterized. The figure below illustrates the quality of the refinements possible to the pair distribution function G(r) using such models, and details of atomic displacements determined from these fits.

High Energy Absorption/Phase Contrast Tomography
Absorption and phase contrast tomography are carried out in various modes on ID15A, both as a complementary technique during XRD-CT and as a standalone method when high energy and speed are required. The permanently mounted imaging cameras give a flexible choice of conditions for these studies, and can be used with the full range of sample environments and many of the ancillary probes.
For example, Bayram et al. studied MXene aerogels for applications as super-capacitor electrodes. The samples were made by freeze-casting Ti3C2Tx aqueous suspensions to produce electrodes with excellent performance characteristics. In order to understand the effect of architectural features on electrochemical performance, absorption tomography was carried out on the samples with different microsctructure induced by compression, while monitoring their electrochemistry. A volume of sample was scanned with Micro-CT at three different stages: uncompressed (MA with initial thickness 10 mm), compressed down to 5 mm, and compressed down to 3 mm. Tomograms of the three state are shown in the figure below, from left to right, respectively. It was found that by increasing the density of the P-MAs upon pressing, the volumetric capacitance gradually increases while the gravimetric capacitance drops. These studies thus serve as a guide to tune the internal porous architecture to maximise performance.

Examples of recent highlights
Spatially quantifying crystallographic heterogeneities in operating Li-ion electrodes
Spatially resolving the state of charge in Li-ion electrodes
Operando imaging of a methane-reforming catalyst bed
Donal Finegan wins the Young Scientist Award at the ESRF's 2020 User Meeting
Polymer interfaces studies by XRD-CT
partners


European Synchrotron Radiation Facility - 71, avenue des Martyrs, CS 40220, 38043 Grenoble Cedex 9, France.