- Home
- Users & Science
- Scientific Documentation
- ESRF Highlights
- ESRF Highlights 2003
- X-ray Imaging
- Quantitative 3D Elemental Microanalysis by Combined X-ray Transmission, Fluorescence and Compton Helical Microtomography
Quantitative 3D Elemental Microanalysis by Combined X-ray Transmission, Fluorescence and Compton Helical Microtomography
The understanding, control and modification of environmental, chemical and biological processes necessitate their thorough investigation. Certain trace elements (e.g. Cr, Se) play an important and not fully understood role in these processes. Therefore, non-destructive, quantitative, 3D, in situ investigation of the trace element distribution at (sub)micrometre resolution and their relationship with morphological features is of great interest. While several existing methods (absorption, phase contrast, Compton-tomography) can provide information about the internal structure at the (sub)micrometre scale, only a few techniques (e.g. X-ray fluorescence, energy filtered transmission electron microscopy, particle induced X-ray emission tomography) are capable of revealing information about the internal elemental composition. Among these methods only X-ray fluorescence tomography is non-destructive. X-ray fluorescence tomography is based on the detection of characteristic X-ray fluorescence photons. It provides the internal distribution of each chemical element that yields a significant fluorescence signal. However, no information can be obtained about the composition and morphology of the light elements (Z < 13 at ID22) due to their 'non-detectable' fluorescence signals. Since the measured elemental distributions can be significantly modified by the self-absorption within this partly unknown matrix, complementary information is necessary for the quantification of the elemental distributions.
 |
|
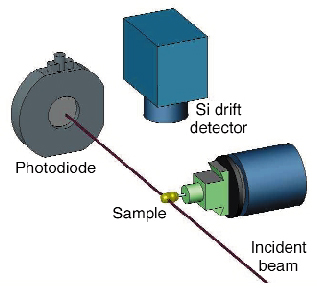
Fig. 137: Experimental setup for a combined transmission, fluorescence and Compton tomography experiment. The sample is scanned in the monochromatic beam of 1-3 µm2 (vertical-horizontal) spot-size. Two photodiodes measure the intensity of the incident and of the transmitted beam (indicated in the figure). A Si drift detector measures the fluorescence and Compton signals. |
In order to obtain precise quantitative internal elemental distributions, a new non-destructive X-ray technique has been developed at ID22 by combining simultaneous transmission, fluorescence and Compton microtomography [1] (see Figure 137 for the experimental setup). Conventional transmission tomography provides the distribution of the total absorption coefficient inside the sample. Compton tomography is based on the signal originating from inelastic single-scattering. With appropriate corrections it can be used for reconstructing the internal electronic density distribution. With the combination of the information of the three tomographic techniques (Integrated Tomographic Technique, ITT [1]) a precise quantitative reconstruction of the internal elemental composition and structure of the measured slice can be obtained.
In order to obtain a truly-volumetric reconstruction, 3D combined XRF/Compton/transmission tomography was performed by a helical scan of the sample in the microbeam [2]. It has been proven that, for a given measurement time, helical tomography provides better longitudinal resolution than conventional tomography.
This method was applied for the first time to the combined tomography technique at ID22. A set of planar projections was obtained from the raw helical scan data via the fullscan interpolation method. The quantitative reconstruction of each planar slice was obtained by the Integrated Tomographic Technique (ITT).
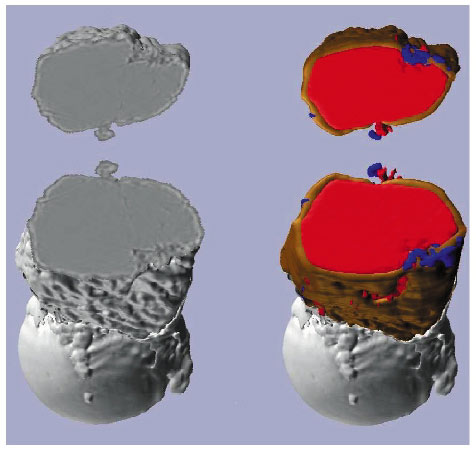
Figure 138 shows an application of this method for the investigation of a single waste fly ash particle [3]. Waste fly ash is created during the combustion process in power plants and it consists of fine particles containing potentially toxic trace metals (i.e. Pb, Ni, Cu, Cd) in concentrated amounts. Failure to properly tackle the problems associated with the utilisation and disposal of fly ash has serious environmental consequences (air and water pollution). The development of routines for intelligent ash management necessitates knowledge of the chemical properties (quantitative elemental distribution, speciation, morphology) of the ash material at bulk- and micro-level. Individual particle analysis is also a unique method for verifying the theoretical models of fly ash forming mechanisms. In Figure 138 the distributions of Rb, Mn and Fe are shown as an example. The combined helical tomography reveals that the external layer of the particle has different elemental composition than its inner part. The presence of a fragmented part with higher iron concentration can also be distinguished. These observations give unique information about the possible fly ash formation mechanisms (e.g. volatilisation, condensation, diffusion, solid solution formation) during combustion.
 |
|
Fig. 138: Three-dimensional rendering of conventional transmission tomography (left) and of the distribution of Rubidium (red), Manganese (brown) and Iron (blue). The sample is glued on the top of a silica capillary, which is partly visible in the lower part of the images. The fly ash particle has been scanned with 7 helical turns, 12 µm/turn helical pitch, 120 angular steps per turn of 3 degrees each, times 80 vertical translation steps of 3 µm each. The measurement time was 1 s/step. Voxel size 3x3x3 µm3. |
In conclusion, a new method to reconstruct the 3D internal elemental composition and its relation with the sample structure has been developed and tested at ID22.
References
[1] B. Golosio, A. Simionovici, A. Somogyi, L. Lemelle, M. Chukalina, A. Brunetti, J. Appl. Phys. 94, 145-156 (2003).
[2] B. Golosio, A. Somogyi, A. Simionovici, P. Bleuet, L. Lemelle, J. Susini, accepted for Appl. Phys. Lett..
[3] M. C. Camerani Pinzani, B. Golosio, A. Somogyi, A. Simionovici, B. M. Steenari, I. Panas, accepted for publication in Anal. Chemistry.
Authors
B. Golosio (a), A. Somogyi (a), A. Simionovici (a, b), P. Bleuet (a), J. Susini (a).
(a) ESRF
(b) Laboratoire de Sciences de la Terre de l'ENS Lyon (France)
partners


European Synchrotron Radiation Facility - 71, avenue des Martyrs, CS 40220, 38043 Grenoble Cedex 9, France.