- Home
- Users & Science
- Scientific Documentation
- ESRF Highlights
- ESRF Highlights 2007
- Materials Science
- Melting of lead under high pressure using second-scale time-resolved X-ray diffraction
Melting of lead under high pressure using second-scale time-resolved X-ray diffraction
The phase diagram of an element reflects the evolution of its chemical bonds, through the phases adopted under different pressure and temperature conditions. The high pressure and high temperature phase diagrams of the elements are only partially known, despite their importance for fundamental condensed matter physics and their implication for planetary physics [1]. For example, knowing the melting point of iron at 329 GPa would lead to prediction of the temperature at the Earth’s inner core boundary, which would help to establish a reliable thermal model of the deep Earth [2].
For most of the elements, the sequence of phase changes by ambient temperature compression has been observed up to at least 100 GPa. First-order phase changes have also been inferred from the analysis of shock compression data, but only along the Hugoniot curve of each element. Although the laser-heated diamond-anvil cell technique allows extreme conditions (~ 200 GPa and 5000 K [2]) to be reached, in situ crystallographic measurements have only rarely been carried out under these conditions. For instance, the usual diagnostic for melting is based on the observation of changes in the optical properties of the laser-heated sample’s surface [2,3]. Surprisingly, the melting curve measured using this method is lower than the melting points measured by shock compression for several elements, such as lead [4].
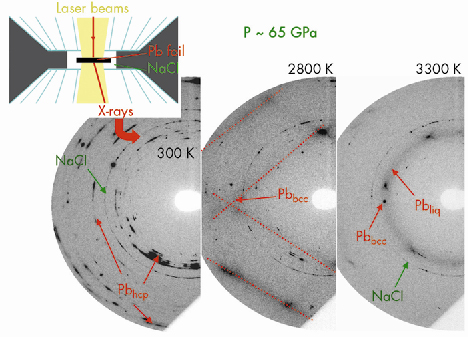
We have developed a technique for the determination of high pressure and high temperature phase diagrams, based on the coupling of laser-heated diamond-anvil cell and short timescale X-ray diffraction. Using this technique, we have unambiguously detected the melting of lead, up to 80 GPa and 3700 K, by recording the X-ray pattern characteristic of a liquid sample (Figure 33). We observed that melting has a lifetime that can be as low as 1 s, which corresponds to the timescale of the diffraction technique used here. This explains why numerous previous trials to detect melting by X-ray diffraction with a timescale of ~30 s have been unsuccessful. This melting criterion is objective, which is a large improvement over the “classical” diagnosis of melting.
 |
|
Fig. 33: Three monochromatic diffraction patterns recorded upon temperature increase at P ≈ 65 GPa. The signal from the lead foil can be clearly distinguished: it first transforms from a hexagonal closed packed (hcp) to a body centered cubid (bcc) solid phase and then melts at ~3300 K. The NaCl pressure-transmitting medium remains solid. |
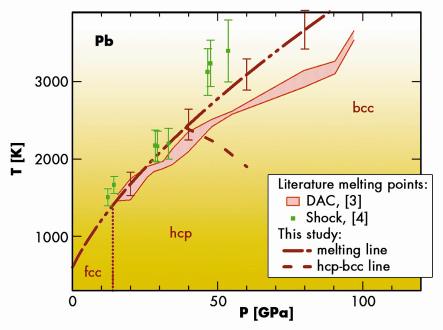
The melting curve of lead obtained in this study lies significantly above the melting curve measured using “classical” diagnostic measurements [3] (Figure 34). It is in agreement with the melting points obtained by shock-wave compression [4]. We have also been able to locate the hcp-bcc-liquid triple point and the hcp-bcc transition line for solid lead. Fast and reliable, the technique used in this work opens a new avenue in the study of high pressure and high temperature phase diagrams.
 |
|
Fig. 34: High pressure high temperature phase diagram of lead established in the literature [3,4] and in the present study. |
References
[1] E.Y. Tonkov and E.G. Ponyatovsky, Phase transformations of elements under high pressure, CRC Press, London, (2005).
[2] R. Boehler, Nature, 363, 534 (1993).
[3] B.K. Godwal, C. Meade, R. Jeanloz, A. Garcia, A.Y. Liu, M.L. Cohen, Science, 248, 462 (1990).
[4] D. Partouche-Sebban, J.L. Pélissier, F.G. Abeyta, W.W. Anderson, M.E. Byers, D. Dennis-Koller, J.S. Esparza, R.S. Hixson, D.B. Holtkamp, B.J. Jensen, J.C. King, P.A. Rigg, P. Rodriguez, D.L. Shampine, J.B. Stone, and D.T. Westley, S.D. Borror and C.A. Kruschwitz, J. Appl. Phys. 97, 043521 (2005).
Principal publication and authors
A. Dewaele (a), M. Mezouar (b), N. Guignot (b,c) and P. Loubeyre (a), Phys. Rev. B 73, 144106 (2007).
(a) CEA, Bruyères le Châtel (France)
(b) ESRF
(c) Synchrotron Soleil (France)
partners


European Synchrotron Radiation Facility - 71, avenue des Martyrs, CS 40220, 38043 Grenoble Cedex 9, France.