- Home
- Users & Science
- Scientific Documentation
- ESRF Highlights
- ESRF Highlights 2009
- Structure of materials
- Combining spectroscopy and simulations to probe the structural properties of Ge/Si(001) nano-islands
Combining spectroscopy and simulations to probe the structural properties of Ge/Si(001) nano-islands
Both long- and short- range scales are of interest when studying structural properties of matter such as hetero nanostructures. This is particularly true for the study of a materials growth mechanism as well as for its electronic and optical properties, strain, chemical composition, interface quality, and atomic ordering [1]. To address such a general issue, we have combined grazing-incidence multiwavelength anomalous diffraction spectroscopy (MAD) and grazing-incidence diffraction anomalous fine structure (DAFS) spectroscopy at beamline BM02. This unique combination, together with recent atomistic simulations based on molecular dynamics (MD), is a powerful approach to disentangle strain and composition and to detect atomic ordering inside SiGe nano-islands.
 |
|
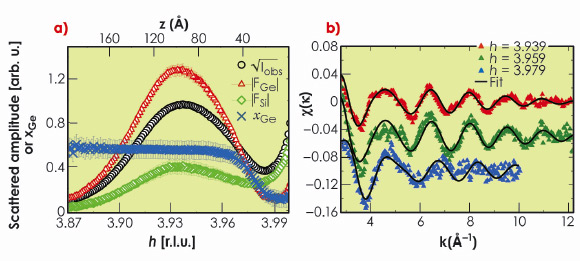
Fig. 36: a) MAD results. Square root of the diffracted intensity measured at 11.053 keV (50 eV below Ge K edge) and at an incidence angle |
We present here some recent results on dome-shaped Ge nano-islands grown on nominally flat Si(001) at 650°C by molecular beam epitaxy (MBE). Their average size and height were about 80 nm and 19 nm, respectively. MAD was performed at the Ge K-edge (11103 eV), close to the in-plane Si 400 Bragg reflection at an incident angle ![]() i = 0.1° (the Si critical angle
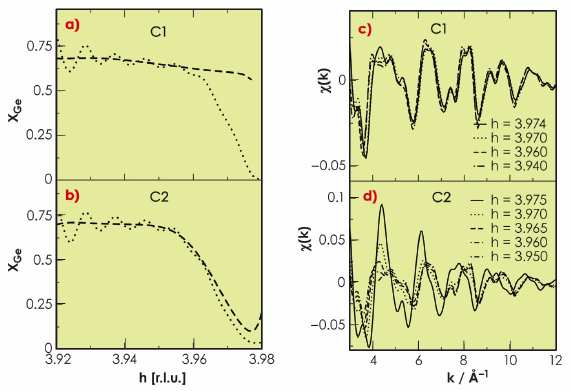
i = 0.1° (the Si critical angle ![]() c = 0.163° at 11 keV). Figure 36a shows the square root of the scattered intensity at 11053 eV (Iobs), the modulus of the Ge and Si structure factors, as well as the Ge content (xGe), as a function of the reciprocal lattice index h and height (z) above the Si surface (h can be associated with different heights z in the nano-islands, according to the iso-strain method). MAD results clearly show a strong Si/Ge intermixing, the Ge content is about 0.6, together with a slight linear increase of xGe starting above z = 4 nm. Figure 36b shows background-subtracted extended DAFS spectra together with the best-fit curves. The three experimental EDAFS spectra were recorded in grazing-incidence geometry, close to the in-plane Si 440 Bragg reflection, at h = 3.939, 3.959, and 3.979, corresponding to z = 3 nm, 6 nm and 9 nm, respectively. The fits show that the Ge content increases slightly from the base to top of the dome (xGe = 0.54 and 0.6 at h = 3.959 and 3.939, respectively). The EDAFS results are in very good agreement with MAD results, except near the Si Bragg peak corresponding to the substrate-island interface region (h = 3.979). Interestingly, in this region, the Ge content obtained from MAD (xGe ~ 0.2) is lower than that obtained from EDAFS (xGe = 0.55). MD simulations clearly show (Figure 37) that in the case of an island-substrate interface with a sharp change in GeSi composition, information is lost, and an artificially smooth gradient is found by MAD owing to the scattering contribution of the strained Si substrate region beneath the islands (Figure 37a). In contrast EDAFS oscillations are much less sensitive to the presence of the interface (Figure 37c), since EDAFS spectroscopy probes only the Ge local environment. Therefore, there was no evidence for the presence of a Si-rich core below 4-5 nm in the nano-islands that we have studied, as suggested by others.
c = 0.163° at 11 keV). Figure 36a shows the square root of the scattered intensity at 11053 eV (Iobs), the modulus of the Ge and Si structure factors, as well as the Ge content (xGe), as a function of the reciprocal lattice index h and height (z) above the Si surface (h can be associated with different heights z in the nano-islands, according to the iso-strain method). MAD results clearly show a strong Si/Ge intermixing, the Ge content is about 0.6, together with a slight linear increase of xGe starting above z = 4 nm. Figure 36b shows background-subtracted extended DAFS spectra together with the best-fit curves. The three experimental EDAFS spectra were recorded in grazing-incidence geometry, close to the in-plane Si 440 Bragg reflection, at h = 3.939, 3.959, and 3.979, corresponding to z = 3 nm, 6 nm and 9 nm, respectively. The fits show that the Ge content increases slightly from the base to top of the dome (xGe = 0.54 and 0.6 at h = 3.959 and 3.939, respectively). The EDAFS results are in very good agreement with MAD results, except near the Si Bragg peak corresponding to the substrate-island interface region (h = 3.979). Interestingly, in this region, the Ge content obtained from MAD (xGe ~ 0.2) is lower than that obtained from EDAFS (xGe = 0.55). MD simulations clearly show (Figure 37) that in the case of an island-substrate interface with a sharp change in GeSi composition, information is lost, and an artificially smooth gradient is found by MAD owing to the scattering contribution of the strained Si substrate region beneath the islands (Figure 37a). In contrast EDAFS oscillations are much less sensitive to the presence of the interface (Figure 37c), since EDAFS spectroscopy probes only the Ge local environment. Therefore, there was no evidence for the presence of a Si-rich core below 4-5 nm in the nano-islands that we have studied, as suggested by others.
 |
|
Fig. 37: Molecular dynamics simulations. MAD and extended DAFS of SiGe/Si(100) islands (aspect ratio equal to 0.16, about 20x106 atoms). Ge concentration (---) corresponding to a sharp (a, model C1) and smooth (b, model C2) composition gradient and Ge concentration (…) extracted back from the simulated MAD. An artificial composition gradient is found in the case of model C1 (c)-(d) Extended DAFS |
In summary, this study demonstrates the great power of combining MAD and EDAFS and shows that atomistic simulations at a realistic scale (20x106 atoms in the present case) are of fundamental importance for providing a deeper and more reliable data interpretation.
Reference
[1] J. Stangl, V. Holy and G. Bauer, Rev. Mod. Phys. 76, 725 (2004).
Principal publication and authors
N.A. Katcho (a), M.-I. Richard (b,c), O. Landré (b), G. Tourbot (b), M.G. Proietti (d), H. Renevier (e), V. Favre-Nicolin (b), B. Daudin (b), G. Chen (f), J.J. Zhang (f), and G. Bauer (f), Journal of Physics: Conference Series, (2009); M.-I. Richard (b,c), N.A. Katcho (a), M.G. Proietti (d), H. Renevier (e), V. Favre-Nicolin (b), Z. Zhong (f), G. Chen (f), M. Stoffel (g,h), O. Schmidt (g,h), G. Renaud (b), T.U. Schülli (b), and G. Bauer (f), Eur. Phys. J. Special Topics 167, 3 (2009).
(a) Univ. Complutense Madrid (Spain)
(b) CEA Grenoble, INAC (France)
(c) Univ. Paul Cézanne, IM2NP, Marseille (France)
(d) Univ. Zaragoza, ICMA (Spain)
(e) Grenoble INP Minatec, LMGP (France)
(f) Johannes Kepler Univ. Linz (Austria)
(g) IFW Dresden (Germany)
(h) MPI Stuttgart (Germany)
partners


European Synchrotron Radiation Facility - 71, avenue des Martyrs, CS 40220, 38043 Grenoble Cedex 9, France.