- Home
- Users & Science
- Scientific Documentation
- ESRF Highlights
- ESRF Highlights 2007
- X-ray Imaging and Optics
- Revealing the presence and nature of living microorganisms in rocks
Revealing the presence and nature of living microorganisms in rocks
Microbial life colonised all lithospheric environments wherever carbon and energy sources, subsurface porosity, and temperature permit and it is now well recognised that the Earth subsurface is a major habitat for prokaryotes [1]. Moreover, the number of microbes that thrive deep below ground probably exceeds the number found in other components of the biosphere, thus contributing significantly to the overall biomass and biodiversity on Earth. Therefore the study of this deep biosphere has important implications for our understanding of global biogeochemical cycles and interactions between the biosphere and the geosphere [2].
 |
|
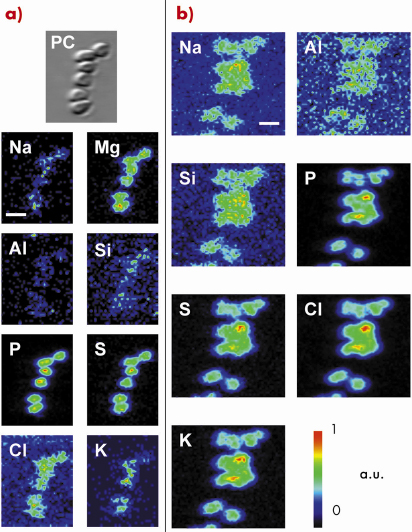
Fig. 135: Cultured D. radiodurans cells as shown by X-ray microscopy in transmission and fluorescence modes on (a) Ultralene® film and (b) carbonate. Phase-contrast X-ray image (PC) and two-dimensional elemental distributions, showing the same field of view, were obtained using 70 and 2000 ms/pixel integration time with an associated pixel size of 0.1 * 0.1 and 0.2 * 0.2 µm2, respectively. The scale bar corresponds to 2 µm (a.u. is for arbitrary unit). |
One of the key challenges in the understanding of the complexities of the subsurface and its microbial inhabitants is the exploration of the metabolic diversity of the prokaryotic populations, their energy sources, and biogeochemical transformations. Here we demonstrated the ability of scanning X-ray microscopy using synchrotron radiation to localise and investigate the phylogenetic affiliation of individual prokaryotic cells on various mineral surfaces (e.g. silicates, carbonates, basaltic glass). This was achieved by applying a newly developed protocol based on fluorescence in situ hybridisation coupled to ultra-small immunogold. For this purpose, universal and specific fluorescein-labelled oligonucleotide probes were hybridised to the ribosomal RNA of prokaryotic microorganisms in heterogeneous cell mixtures (i.e. a simple model composed of a 1:1 mix of cultivable bacteria from different taxonomic divisions, namely Escherichia coli and Deinococcus radiodurans). Antibodies against fluorescein coupled to subnanometre gold particles were then used to label the hybridised probes in the ribosome. After increasing the diameter of the metal particles by silver enhancement to optimise their detection, the specific gold-silver signal was visualised on various substrates by using the scanning X-ray microscope operating at beamline ID21. This method involves associating heavy metal fluorescence signals emerging specifically from the gold-silver nanoparticles to the location of microbes, highlighted by their light element fluorescence (Figure 135). These spatial distributions constitute the cell chemical fingerprint, firmly elaborated by taking advantage of the morphological and spatial information provided by the phase contrast X-ray imaging. Figure 136 highlights the successful localisation of a specific gold-silver signal on carbonates at the single prokaryotic-cell level, with a satisfactory detection efficiency and spatial resolution. Overall, this potentially allows imaging the presence and nature of living microorganisms in rock samples. The possibility to simultaneously link the phylogenetic identification of microorganisms with the chemical and structural characterisation of associated mineral phases (
i.e. inorganic substrate and biomineralisation that constitute metabolic reactants and byproducts) by using complementary synchrotron-based methods (i.e. X-ray microdiffraction and X-ray absorption microspectroscopy) offers great innovation for assessing the geochemical impact of subsurface microbial communities and unravelling microbe and mineral interactions in the deep biosphere.
 |
|
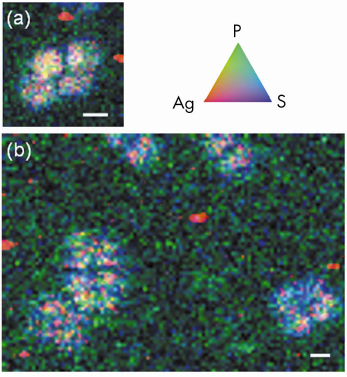
Fig. 136: Duplicates X-ray microscopy observations of silver-enhanced ultra small immunogold particles in single tetrads of D. radiodurans hybridised with fluorescein-labelled bacterial probe EUB338 on carbonates. Tricolor (RGB) synchrotron X-ray fluorescence elemental maps were obtained by scanning the surface at pixel size of 0.25 * 0.25 µm2 and 0.33 * 0.33 µm2 and with integration time of 3000 ms/pixel and 2000 ms/pixel for panels (a) and (b), respectively. The scale bars correspond to 2 µm for each. Red codes for Ag, green for P, and blue for S. Each pixel is coloured in proportion to their respective signal. This finally allows hybridised cells that display a good spatial correlation between S, P, and Ag to be distinguished from individual Ag grains (in red) belonging to the background signal. |
References
[1] J.P. Amend, A. Teske, Palaeogeogr. Palaeoclimatol. Palaeoecol., 219, 131-155 (2005).
[2] J.K. Fredrickson, T.C. Onstott, In: J.K. Fredrickson and M. Fletcher (Eds), Subsurface Microbiology and Biogeochemistry, New York, pp. 3-37 (2001).
Principal publication and authors
B. Ménez (a,b), C. Rommevaux-Jestin (a,b), M. Salomé (c), Y. Wang (d), P. Philippot (a,b), A. Bonneville (a), E. Gérard (a,b,e), Chem. Geol., 240, 182-192 (2007); E. Gérard (a,b,e), F. Guyot (a,d), P. Philippot (a,b), P. Lopez-Garcia (e), J. Microbiol. Methods, 63, 20-28 (2005).
(a) Centre de Recherches sur le Stockage Géologique du CO2 (IPGP/TOTAL/SCHLUMBERGER), IPGP, CNRS UMR 7154, Paris (France)
(b) Géobiosphère Actuelle et Primitive, IPGP, CNRS UMR 7154 & Université Denis Diderot (Paris)
(c) ESRF
(d) IMPMC, Paris (France)
(e) ESE, CNRS UMR 8079, Université Paris-Sud, Orsay (France)
partners


European Synchrotron Radiation Facility - 71, avenue des Martyrs, CS 40220, 38043 Grenoble Cedex 9, France.