- Home
- Users & Science
- Scientific Documentation
- ESRF Highlights
- ESRF Highlights 2005
- X-ray Imaging and Optics
- Evidence of Ion Diffusion at Room Temperature in Microcrystals of the Bi2Sr2CaCu2O8+delta Superconductor
Evidence of Ion Diffusion at Room Temperature in Microcrystals of the Bi2Sr2CaCu2O8+delta Superconductor
Single crystals of the Bi2Sr2CaCu2O8+![]() (Bi-2212) high-Tc superconductor can be grown in samples whose length (≥ 500 µm) is much greater than both their width and their thickness (whiskers). These kinds of samples have recently attracted remarkable interest from the point of view of both basic and applied physics. In fact, they have proved to be suitable systems for the study of the excess conductivity above Tc and of the transport properties along the c axis because of their high quality and small sizes [1].
(Bi-2212) high-Tc superconductor can be grown in samples whose length (≥ 500 µm) is much greater than both their width and their thickness (whiskers). These kinds of samples have recently attracted remarkable interest from the point of view of both basic and applied physics. In fact, they have proved to be suitable systems for the study of the excess conductivity above Tc and of the transport properties along the c axis because of their high quality and small sizes [1].
Bi-2212 whiskers undergo a significant increase in the in-plane resistivity when aged at room temperature, most likely because of the oxygen loss [2]. Variations in the O non-stoichiometry of Bi-2212 whiskers must be accompanied by a change of the Cu oxidation state to guarantee the electrostatic neutrality. To verify whether the variation of the local Cu oxidation state, induced by O diffusion, is accompanied by a cation migration or not, we have combined µ-XANES and µ-XRF experiments at beamline ID22. Also the c-axis value has been monitored by µ-XRD. A laboratory AFM study supports the ID22 data.
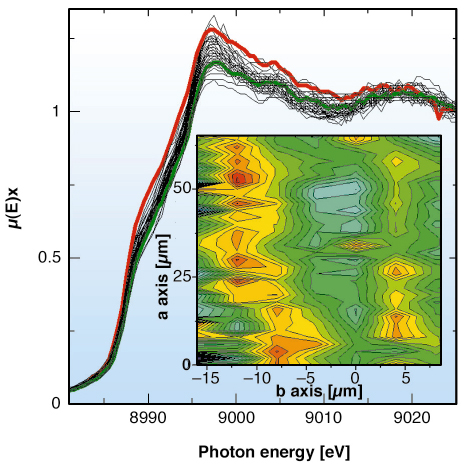
Figure 158 presents the Cu K edge fluorescence µ-XANES spectra. Moving from the central position (green spectrum) to the crystal edge (red spectrum), we observe an increase in the white line intensity of 10% and a red shift of the edge of 2.5 eV. This indicates an important gradient of local structure and in the oxidation state of Cu along the b direction. At the crystal edges a significant Cu+ enrichment is observed (Figure 158). This is where the atomic O2– anions are supposed to recombine to give O2 molecules, which then leave the crystal (leaving behind their 4 electrons). According to previous XANES studies we evaluated that a fraction of about 30% of Cu+ is estimated at the edges [3]. This suggests that the rate-determining step of the O loss process is the O2– migration to the crystal surface and not the O2 recombination at the surface. From the µ-XRF study (Figure 158 inset) a Cu enrichment at the crystal edges along the b direction is found.
 |
|
Fig. 158: Normalised XANES spectra collected on different positions of the Bi-2212 whisker. A shift of the edge up to 2.5 eV, accompanied by a modification of the white line intensity, which clearly displays an important modification of both the oxidation and the coordination state of Cu along the crystal. Bold curves represent spectra collected in central (green) and in near-edge (red) positions along the b direction, the others representing intermediate positions. The inset shows the map (resolution 1 x 4 µm) reporting the ratio between the Cu(K |
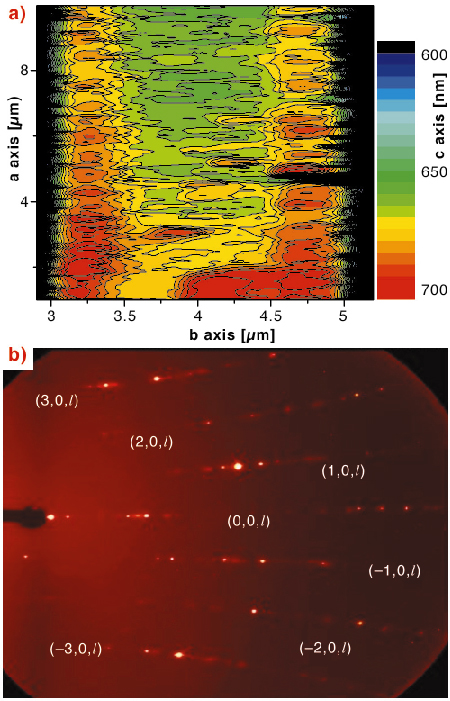
The crystal, exhibiting an almost flat a-b surface in the as-grown condition, clearly shows an increased thickness ![]() z at the borders along the b direction, as determined by AFM (Figure 159a). This is the consequence of the O depletion, which is known to induce an increase of the c axis lattice parameter whose average over the crystal size along the c-axis direction (~ 200 unit cells) has been clearly detected by AFM. The c-axis increase, located at the border of the crystal along the b direction, well correlates with the higher fraction of Cu+ singled out in the same region by µ-XANES (Figure 158). These independent pieces of evidence agree with the anisotropy in the in-plane O diffusion coefficients for Bi-2212 that indicates a slower migration process along the b direction. Therefore, the possibility of identifying a compositional gradient is enhanced. Quantitatively, the measured
z at the borders along the b direction, as determined by AFM (Figure 159a). This is the consequence of the O depletion, which is known to induce an increase of the c axis lattice parameter whose average over the crystal size along the c-axis direction (~ 200 unit cells) has been clearly detected by AFM. The c-axis increase, located at the border of the crystal along the b direction, well correlates with the higher fraction of Cu+ singled out in the same region by µ-XANES (Figure 158). These independent pieces of evidence agree with the anisotropy in the in-plane O diffusion coefficients for Bi-2212 that indicates a slower migration process along the b direction. Therefore, the possibility of identifying a compositional gradient is enhanced. Quantitatively, the measured ![]() z/z (corresponding to
z/z (corresponding to ![]() c/c) is 4%, indicating that the average c value on the b borders is around 32 Å. µ-XRD measurements, collected at ID22 in transmission mode with an image plate, resulted in c = 32.2 Å for the b border region (Figure 159b).
c/c) is 4%, indicating that the average c value on the b borders is around 32 Å. µ-XRD measurements, collected at ID22 in transmission mode with an image plate, resulted in c = 32.2 Å for the b border region (Figure 159b).
 |
|
Fig. 159: (a) Colour scale AFM map of the Bi-2212 sample. The red regions correspond to the edge of the crystal, where a higher thickness has been observed. (b) (h, 0, l) reflections (h = -3, -2, -1, 0, 1, 2 and 3) collected at ID22 in transmission mode with an image plate sampling a point in the border region along the b axis. Beam energy = 17.3 keV. |
References
[1] Y.I. Latyshev, T. Yamashita, L.N. Bulaevskii, M.J. Graf, A.V. Balatsky, and M. P. Maley, Phys. Rev. Lett. 82, 5345-5348 (1999).
[2] M. Truccato, G. Rinaudo, C. Manfredotti, A. Agostino, P. Benzi, P. Volpe, C. Paolini, and P. Olivero, Supercond. Sci. Technol. 15, 1304-1310 (2002).
[3] C. Lamberti, G. Turnes Palomino, S. Bordiga, G. Berlier, F. D’Acapito and A. Zecchina, Angew. Chem. Int. Ed., 39, 2138-2141 (2000).
Principal Publication and Authors
M. Truccato, C. Lamberti, C. Prestipino, A. Agostino, Appl. Phys. Lett., 86, 213116 (2005).
NIS centre of Excellence University of Turin, and INSTM (Italy)
partners


European Synchrotron Radiation Facility - 71, avenue des Martyrs, CS 40220, 38043 Grenoble Cedex 9, France.