- Home
- Users & Science
- Scientific Documentation
- ESRF Highlights
- ESRF Highlights 2001
- Micro-analysis and Imaging
- 3D Microtomography Imaging by Synchrotron Radiation for Quantitative Analysis of Bone Samples
3D Microtomography Imaging by Synchrotron Radiation for Quantitative Analysis of Bone Samples
Osteoporosis is a widespread bone fragility disease, resulting from a negative unbalanced coupling between bone resorption and bone formation. It is becoming a major problem of health and the evaluation of bone quality remains a technical challenge. New treatments such as bisphosphonates have proved to be efficient for reducing fracture risk without the expected increase in bone mass density [1]. Recent studies suggest that the degree of mineralisation, in addition to the amount of bone tissue and the microarchitectural organisation, should be considered when determining bone strength and mechanical resistance to fracture [2].
The availability of three-dimensional measuring techniques coupled to specific image processing methods opens up new possibilities for the analysis of bone structures. In particular, synchrotron radiation microtomography (SR µCT) may provide 3D images with spatial resolution as high as one micrometre. The SR µCT system installed at ID19 has already been used to quantify trabecular bone architecture [3]. However the possibility of doing quantitative tomography using SR had not been tested. We showed that the use of a monoenergetic synchrotron source allows quantitative measurements of the degree of bone mineralisation. To date, the main technique allowing the quantification of the degree of mineralisation in bone was quantitative microradiography of thin polished bone sections [2]. The technique requires an accurate preparation of bone sections, and is limited to a bidimensional (2D) analysis.
 |
Fig. 138: Reconstructed image of iliac crest biopsy sample: 3D display (a) and first 2D slice (b). Voxel size = 10.13 µm. |
SR µCT images may be interpreted as accurate maps of the 3D distribution of the linear absorption coefficient within the volume. Since the absorption depends on the mineral content of bone, we employed a calibration method relating the reconstructed gray level to the degree of mineralisation (concentration of hydroxy apatite). The method was first compared to the reference microradiography technique. Then, it was applied to the analysis of human biopsies from osteoporotic patients before and after one and two years of bisphosphonate treatment (Figure 138). The distribution in concentration of hydroxyapatite evaluated from the biopsies of one patient, before and after one and two years of treatment is illustrated by Figure 139. The shift towards the right of the histogram after treatment indicates that the bone sample is more mineralised. While no significant changes regarding structural parameters were observed with treatment, the statistical analysis exhibited a positive trend towards higher mineralisation. Thus, SR µCT appears as a unique tool for analysing bone samples both in terms of microarchitecture and bone mineral content.
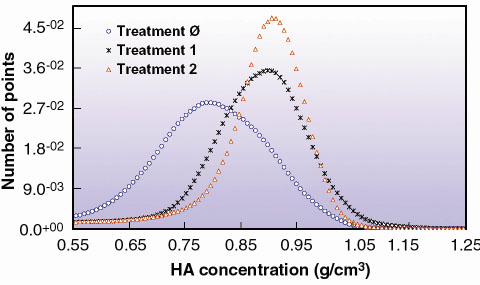 |
Fig. 139: Distribution of hydroxyapatite (HA) concentration in cortical bone for one patient before treatment (Ø), after one year of treatment (1) and after two years of treatment (2). |
References
[1] D.A. Hanley, G. Ioannidis and J.D. Adachi, Journal of Clinical. Densitometry, 3:1, 79-95 (2000).
[2] G.Y. Boivin, P.M. Chavassieux, A.C. Santora, J. Yates and P.J. Meunier, Bone 27, 687-694 (2000).
[3] F. Peyrin, M. Salomé, S. Nuzzo, P. Cloetens, A.M. Laval-Jeantet and J. Baruchel, Cell. Mol. Biol., 46(6), 1089-1102 (2000).
Principal Publication and Authors
S. Nuzzo (a, b), F. Peyrin (a, b), E. Martín-Badosa (c), M.H. Lafage-Proust (d) and G. Boivin (e), IEEE Transaction on Nuclear Science 48:(3), 859-863 2001.
(a) ESRF
(b) CREATIS, INSA, Villeurbanne (France)
(c) Laboratori d'Òptica, Departament de Física Aplicada i Òptica, Universitat de Barcelona (Spain)
(d) INSERM, St Etienne (France)
(e) INSERM, Lyon (France)
partners


European Synchrotron Radiation Facility - 71, avenue des Martyrs, CS 40220, 38043 Grenoble Cedex 9, France.