Figure 118
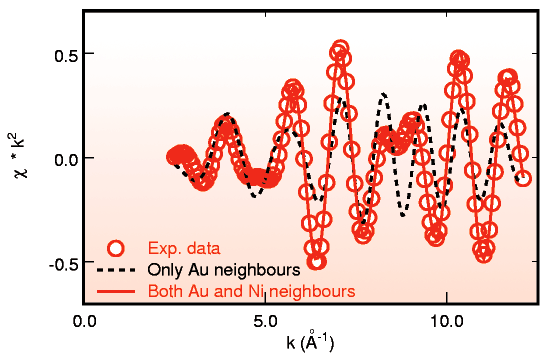
Fig. 118: k2-weighted EXAFS spectrum, ![]() (k), after extraction of the nearest-neighbour shell contribution at the Au L3-edge of the Au/Ni MgAl2O4-supported catalyst. The circles represent experimental data. The dashed curve shows the best fit to the experimental spectrum with only Au amplitude and phase functions. The solid curve shows the best fit to the data with Au and Ni reference functions.
(k), after extraction of the nearest-neighbour shell contribution at the Au L3-edge of the Au/Ni MgAl2O4-supported catalyst. The circles represent experimental data. The dashed curve shows the best fit to the experimental spectrum with only Au amplitude and phase functions. The solid curve shows the best fit to the data with Au and Ni reference functions.
| back to: Design of a Ni/Au Surface Alloy Catalyst for Steam Reforming |
partners


European Synchrotron Radiation Facility - 71, avenue des Martyrs, CS 40220, 38043 Grenoble Cedex 9, France.