Figure 50
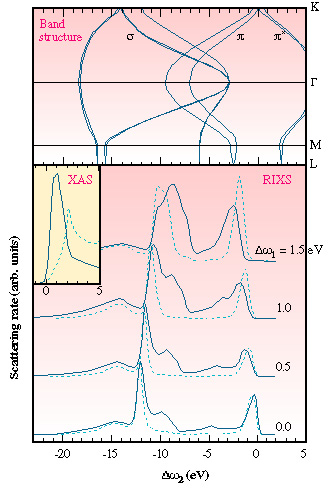
Fig. 50: Upper panel: the band structure of graphite. Lower panel: numerical calculations of the ![]() 2 emission spectrum, for three different values of the incoming photon energies (all energies are labelled relative to the absorption threshold). The independent particle approximation (no electron - core hole interaction) is shown by the dashed lines. The effect of a local U = - 3 eV interaction is shown by the solid lines. The corresponding X-ray absorption profiles are shown in the inset.
2 emission spectrum, for three different values of the incoming photon energies (all energies are labelled relative to the absorption threshold). The independent particle approximation (no electron - core hole interaction) is shown by the dashed lines. The effect of a local U = - 3 eV interaction is shown by the solid lines. The corresponding X-ray absorption profiles are shown in the inset.
partners


European Synchrotron Radiation Facility - 71, avenue des Martyrs, CS 40220, 38043 Grenoble Cedex 9, France.