Figure 19
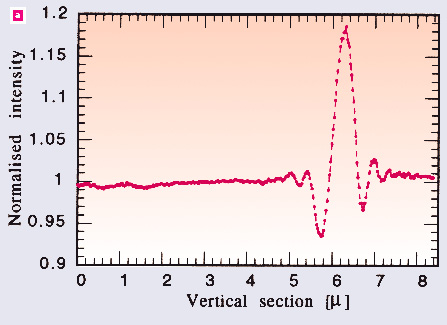
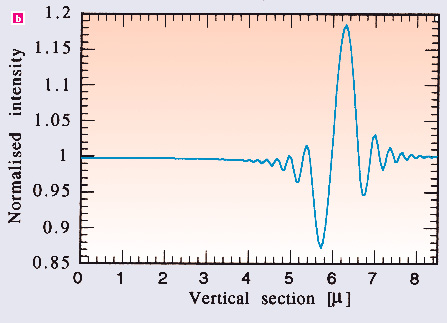
Fig. 19a, b: Experimentally observed (a: red curve) and simulated (b: blue curve) intensity distribution at the right edge of the nylon fibre shown above.
partners


European Synchrotron Radiation Facility - 71, avenue des Martyrs, CS 40220, 38043 Grenoble Cedex 9, France.