Figure 80
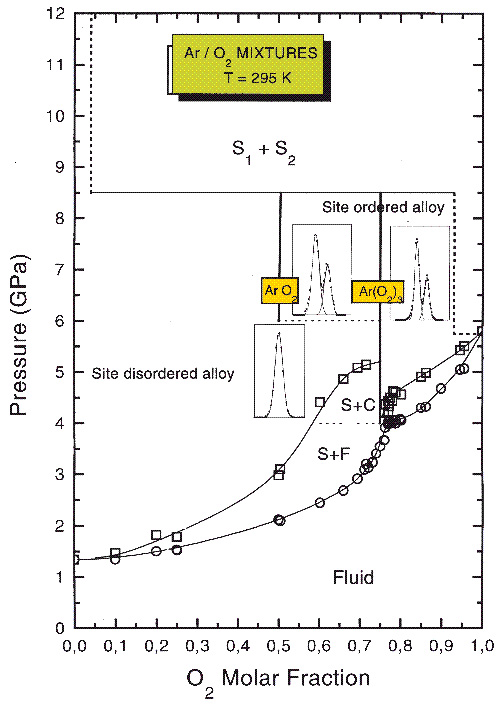
Fig. 80: Ar/O2 mixture phase diagram at 296 K established using optical observation and Raman spectroscopy, and the insets show vibron peaks. Single-crystal diffraction measurements were performed at the ESRF to determine the structure of the alloys at concentrations of 50 mol% and 75 mol% O2 using white beam energy-dispersive single-crystal diffraction.
partners


European Synchrotron Radiation Facility - 71, avenue des Martyrs, CS 40220, 38043 Grenoble Cedex 9, France.