Raman
Overview
Raman spectroscopy is a powerful tool for the investigation of structural details of biomolecules. As the observed vibrational modes are very sensitive to changes of the molecular structure and its environment, even subtle differences between, e.g., different states of a protein or mutant proteins can be detected.
This is particularly true if the the exciting laser is in resonance with an electronic transition of a molecule or a part of it (Resonance Raman effect), since in this case the vibrational modes of the respective moiety (e.g., a chromophore in a protein) are significantly enhanced over other non-resonant vibrational modes. For example, in the case of a resonant cofactor, this makes the surrounding protein matrix essentially invisible, which greatly helps to interpret the oftentimes very complex Raman spectra.
Our spectrometer is an InVia Raman microscope from Renishaw. As excitation source, three lasers (514, 633, and 785 nm) are available, which gives some freedom of choice to select a wavelength which (a) possibly yields resonance enhancement and (b) minimizes interfering fluorescence.
Experimental setup

The Raman head underneath the sample position is equipped with a microscope objective, which focuses the exciting laser onto the sample and collects the scattered light (i.e., back-scattering geometry).
Specifications of the Raman spectrometer
- three lasers are available as excitation source: 514 nm, 633 nm, 785 nm
- compact probe in back-scattering geometry
- power at the sample: > 50 mW (Raman scattering of biological samples is low!)
- excitation focal spot: 50 μm
- spectral range: from 200 cm-1 to 4000 cm-1 with a resolution < 1 cm-1
The setup is described in more detail in a paper by Carpentier et al. [J. Appl. Crystallogr. 40, 1113-1122 (2007)].
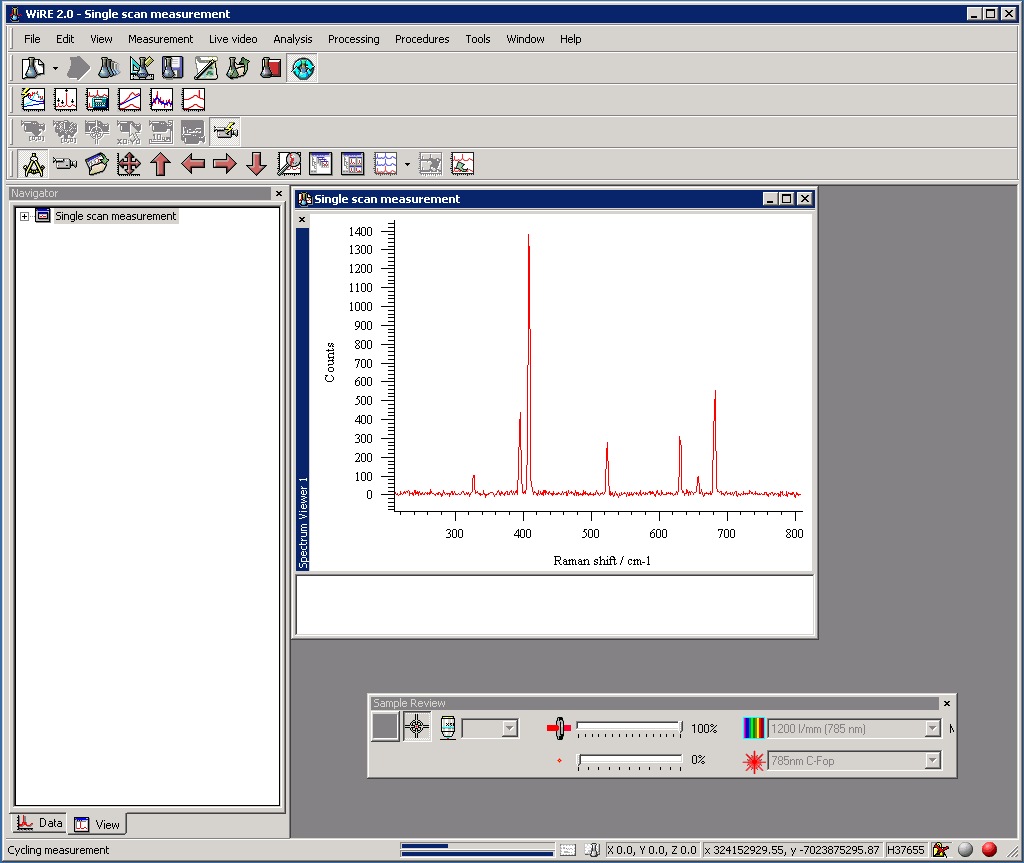
Software
We use the software Wire2 from Renishaw.
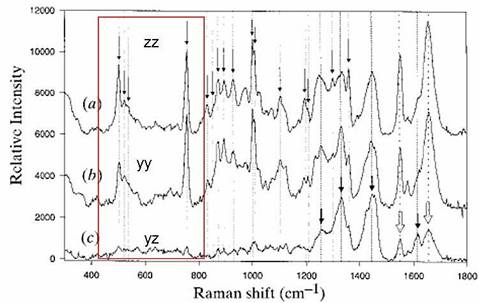
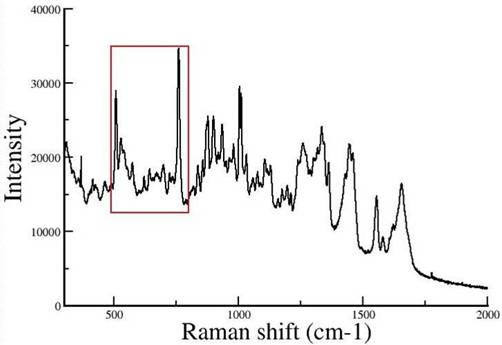
Example
...under construction...
Raman spectra of tetragonal lysozyme single crystals
 |
|
1. |
 |
|
2. |
partners


European Synchrotron Radiation Facility - 71, avenue des Martyrs, CS 40220, 38043 Grenoble Cedex 9, France.